See how water moves across your farm
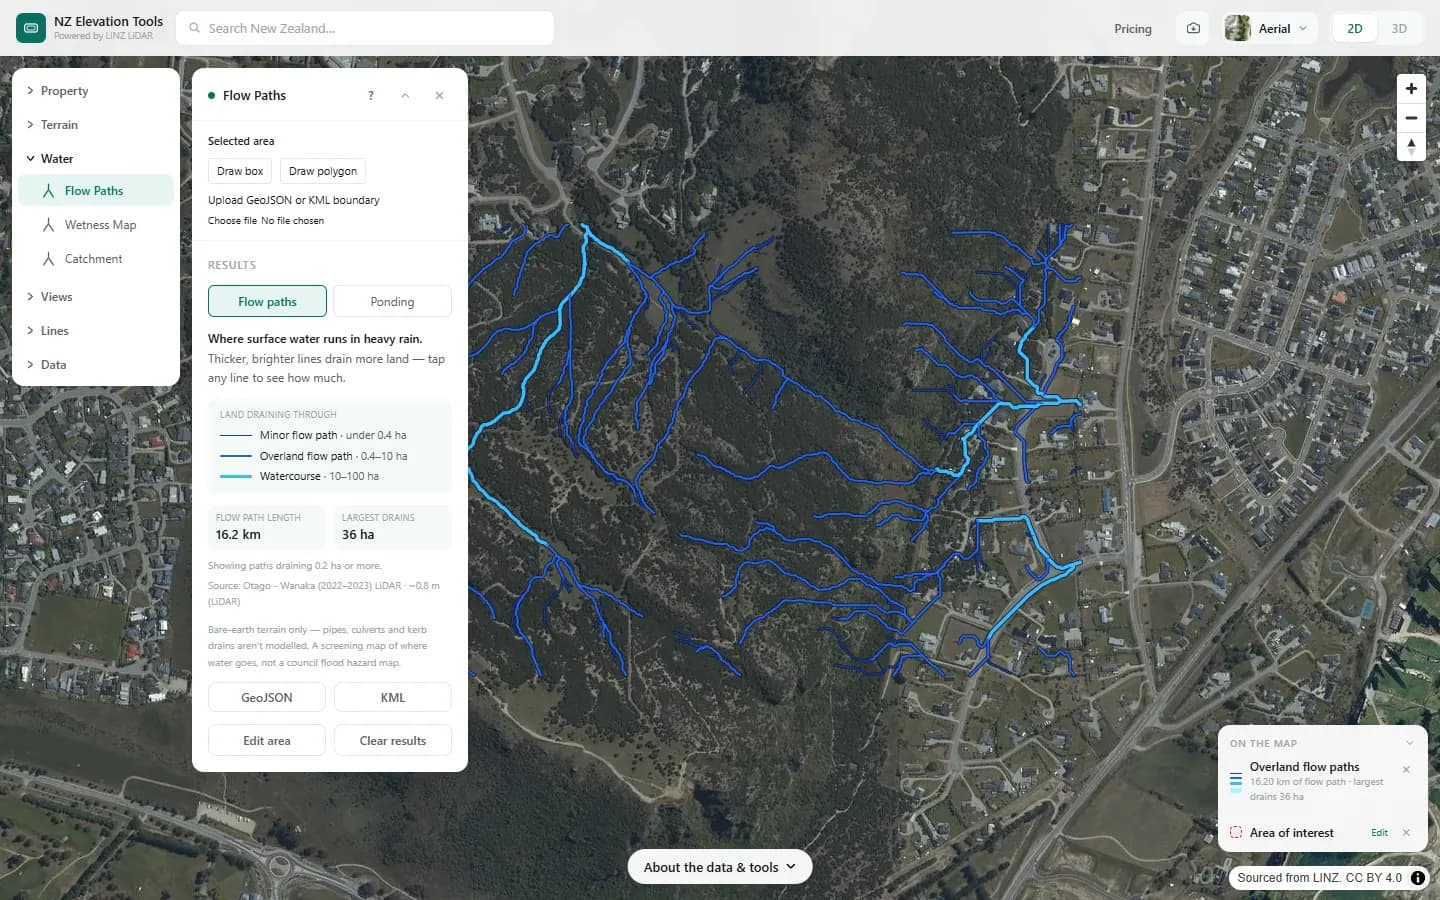
A farm water flow map for any New Zealand farm, traced from the LINZ LiDAR ground model: where runoff gathers as it crosses the paddocks, how many hectares drain through each gully, where water would sit, and how steep each face is. No login and nothing to install. Search the farm, pick the titles and run it.
It is the map side of farm planning. Use it to find the likely critical source areas before you walk them, to put a number on the country above a culvert or a crossing, and to give your adviser a farm map with the water on it. You know where it runs after rain; this shows how the pieces connect, including the land uphill of the boundary.
The workflow
Step 1 · Property
Load the farm boundary
The legal titles as the working area, up to 25 parcels at once, or draw a box around one block. Everything after is clipped to it.
Step 2 · Flow Paths
Map where runoff gathers
Flow paths across the farm, each labelled with the hectares draining through it, and a ponding view of the hollows that hold water.
Step 3 · Catchment
Measure the land above a gully, culvert or crossing
All the land draining to the point you click, in hectares, so you know how much country feeds a swale or a culvert.
Step 4 · Wetness Map
Find the ground that stays wet
A map ranking the farm from dry ridges to the flats and hollows where the shape of the land concentrates water.
Step 5 · Slope & Aspect
Map slope across the paddocks
Slope in degrees for every face, with the share of the area in each slope class, and which way each face points.
Step 6 · Elevation Profile
Check the fall along a fence, track or pipe run
The rise and fall along a line you draw, with the gradient at every point.
Free to run · pay to download
See the full result on the map free, with no account. Download flow paths as GeoJSON or KML, catchment outlines as DXF, GeoJSON or KML, slope and wetness grids as GeoTIFF, and contours as DXF, GeoJSON or KML with a pass: NZ$49 for 7 days or NZ$299 for 12 months, one-off, GST included, not a subscription. Every download on the site is included while the pass lasts.
What it doesn’t replace
- It maps where the ground sends water. It does not model sediment, nutrient or bacteria loss: whether a flow path is a critical source area also depends on soil, stock, crop and whether it reaches a waterway.
- Tile drains, culverts, pipes and narrow open drains are not in the terrain, so water is routed over the surface as if they were not there.
- The ground is as the LiDAR recorded it. Where LiDAR has not been flown the coarser 8 m national model is used, which shows the big gullies and misses the small swales.
- It is not a freshwater farm plan and nobody certifies it. It is a set of maps to put into one, or to take to the person writing it.
- A very large station can exceed a tool’s area limit. Run it block by block.
Questions
Can it find the critical source areas on my farm?
It shows where to look. A critical source area is a gully, swale or depression that gathers runoff and can deliver sediment, nutrients or bacteria to water. The flow path, ponding and wetness maps show where runoff gathers and sits, and how much land feeds each spot. Whether a spot is a real risk depends on what happens on that ground, so walk it, ideally after rain.
Is this a freshwater farm plan?
No. It gives you maps that go into a farm plan: the boundary, slope, flow paths and the land draining to each gully. The plan itself covers risks and actions and is written by you or your adviser to the rules your regional council applies.
Is it free?
Running every tool and looking at the result is free, with no account, and so is saving the map as an image. Downloading data files, such as flow paths for a GIS or Google Earth, needs a pass.
Can I map the whole farm at once?
Usually. Select up to 25 titles together, or draw a box. On a large area the smallest flow paths are left off so the map stays readable, and the panel says where the cut-off sits. For fine detail, run one block at a time.
Can my adviser use the files?
Yes. Flow paths and catchment outlines export as GeoJSON or KML, which open in QGIS, ArcGIS and Google Earth. Slope and wetness export as GeoTIFF grids. A saved map image drops straight into a document.
Guides
- Critical Source Areas: Map Them on Your Farm
- Farm Maps for a Freshwater Farm Plan
- How to Divide Your Farm into Land Units
- Natural or Artificial? Streams, Drains and Ponds on a Farm Map
- What Catchment Am I In?
- Where Is the Nitrate in My Stream Coming From?
- Run-off or Drainage? How Contaminants Reach Water
- How Much Riparian Fencing Do I Need?
- Choosing a Winter Grazing Paddock
- Mapping Farm Drainage: Drains, Wet Ground and Ponding
- Finding Erosion and Slips on Your Farm
- Stream Crossings and Farm Tracks on Your Farm Plan Map
- The Traditional Name of Your Stream or River
- Catchment Area for a Culvert or Stream Crossing
- How Big Should a Farm Wetland Be?
- Overland Flow Paths: Check a Property Before You Buy
- Terrain Checks Before Buying Rural Land
Data
Most map tools read the LINZ elevation tiles in your browser: LINZ’s national bare-earth elevation model, LiDAR where it has been flown and the 8 m model elsewhere. Their own downloads are built in your browser from the same tiles you see on screen. Elevation Change reads the surveys’ own 1 m files directly in your browser. Download Data and the Property Report’s data bundle are built on our server from the 1 m LiDAR model itself and report how much of the area came from the 8 m fallback. Elevate a File reads the same 1 m model on our server but does not report that share.
Elevation and cadastral data is sourced from the LINZ Data Service and licensed for re-use under the Creative Commons Attribution 4.0 International licence. Copyright in each LiDAR survey belongs to the body that commissioned it — a regional or district council, Waka Kotahi, NIWA and around thirty others — rather than to LINZ, which hosts and processes the national dataset. Every file exported from this site names the licensors whose surveys cover the area, and anything you publish from those files carries the same attribution requirement. See https://www.linz.govt.nz/products-services/data/licensing-and-using-data/attributing-elevation-or-aerial-imagery-data Sample image: Sourced from the LINZ Data Service and licensed by Environment Southland, Otago Regional Council and Queenstown-Lakes District Council for re-use under the Creative Commons Attribution 4.0 International licence.