How Much Riparian Fencing Do I Need?
Before the quotes come in, know how many metres of stream you are fencing, and how much land a planted margin would take. Both come off the map.
Keeping stock out of streams is one of the most common actions in a farm plan, and fencing both banks is the biggest cost in it. A farm plan also maps the fencing and any planted riparian areas (MfE, Developing a freshwater farm plan, section 2.2). The first number for both is the length of stream.
Get the fence length for your streams
Click the title and the Property panel gives the mapped stream length and the fence for both banks. Free to use, no login.
Open Property with water on →Measure it in five steps
Shown on a dairy and drystock farm on the edge of the Piako flats in the Waikato, with the numbers the tools gave on 19 November 2026.
Get the total for the mapped streams
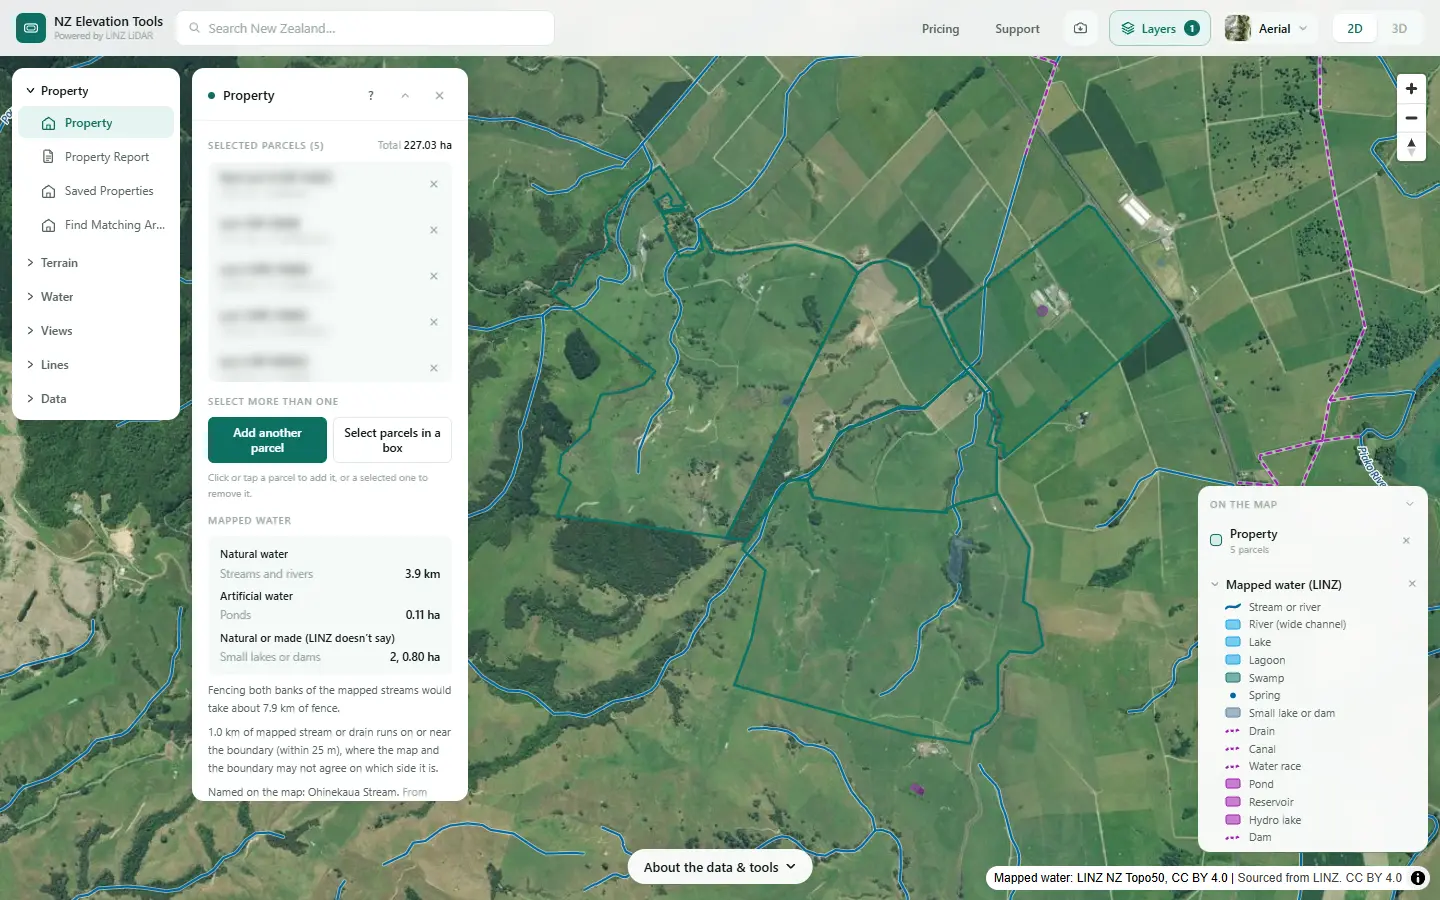
Select the farm with the Property tool. Under Mapped water the panel gives the length of mapped stream inside the boundary and the fence it would take to fence both banks. It also says how much stream runs on or near the boundary, where you and the neighbour may share the fence.
Find the streams the map leaves out
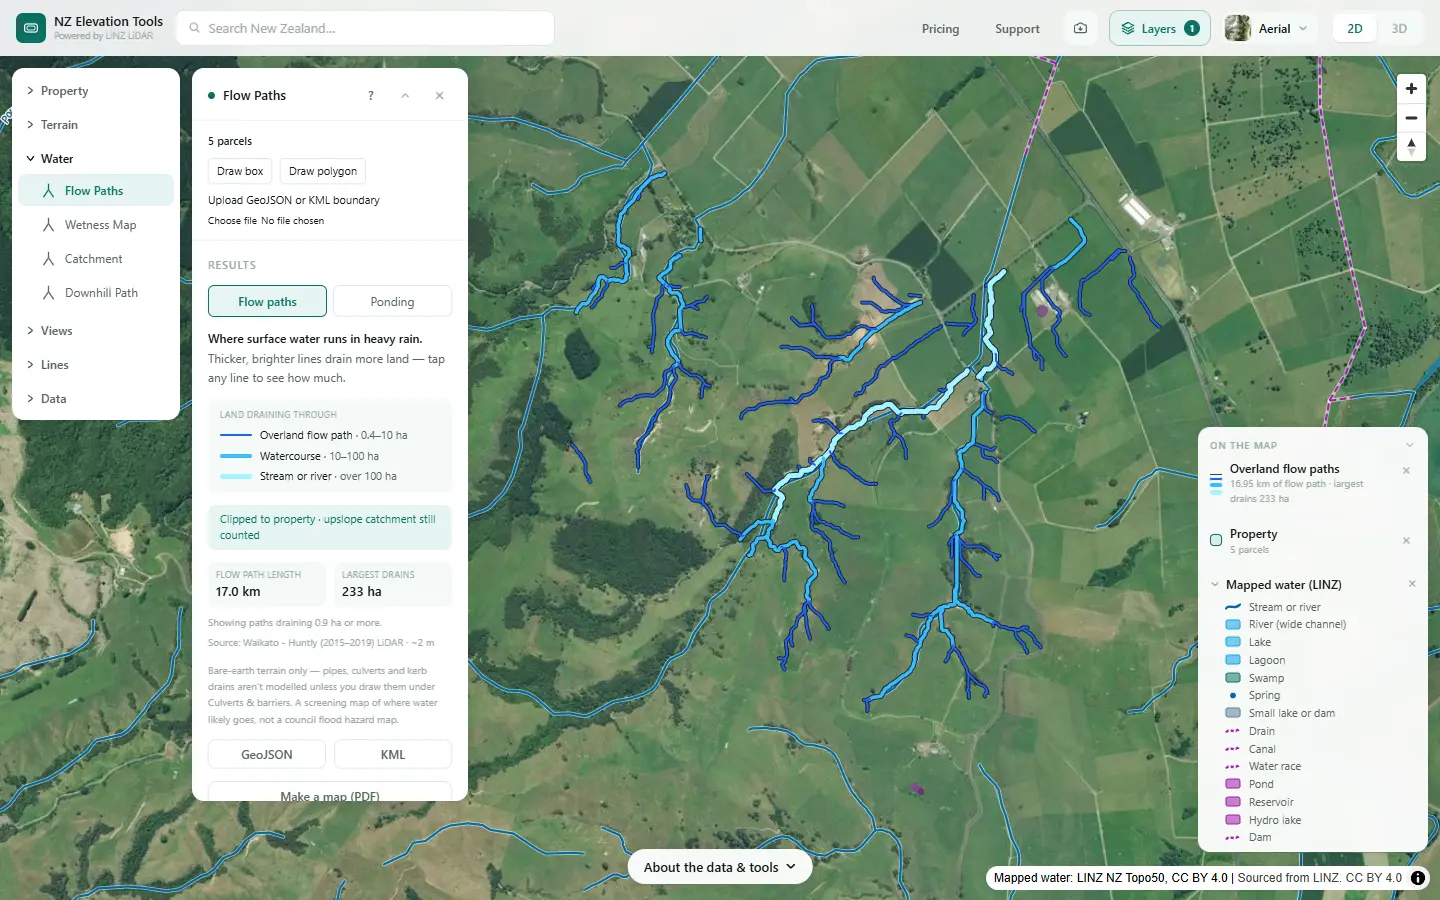
Run Flow Paths with Mapped water on. The brighter lines are watercourses and streams traced from the LiDAR, many of them not on the LINZ map. Walk the ones that carry water in winter and decide which belong in the plan.
Measure each reach you plan to fence
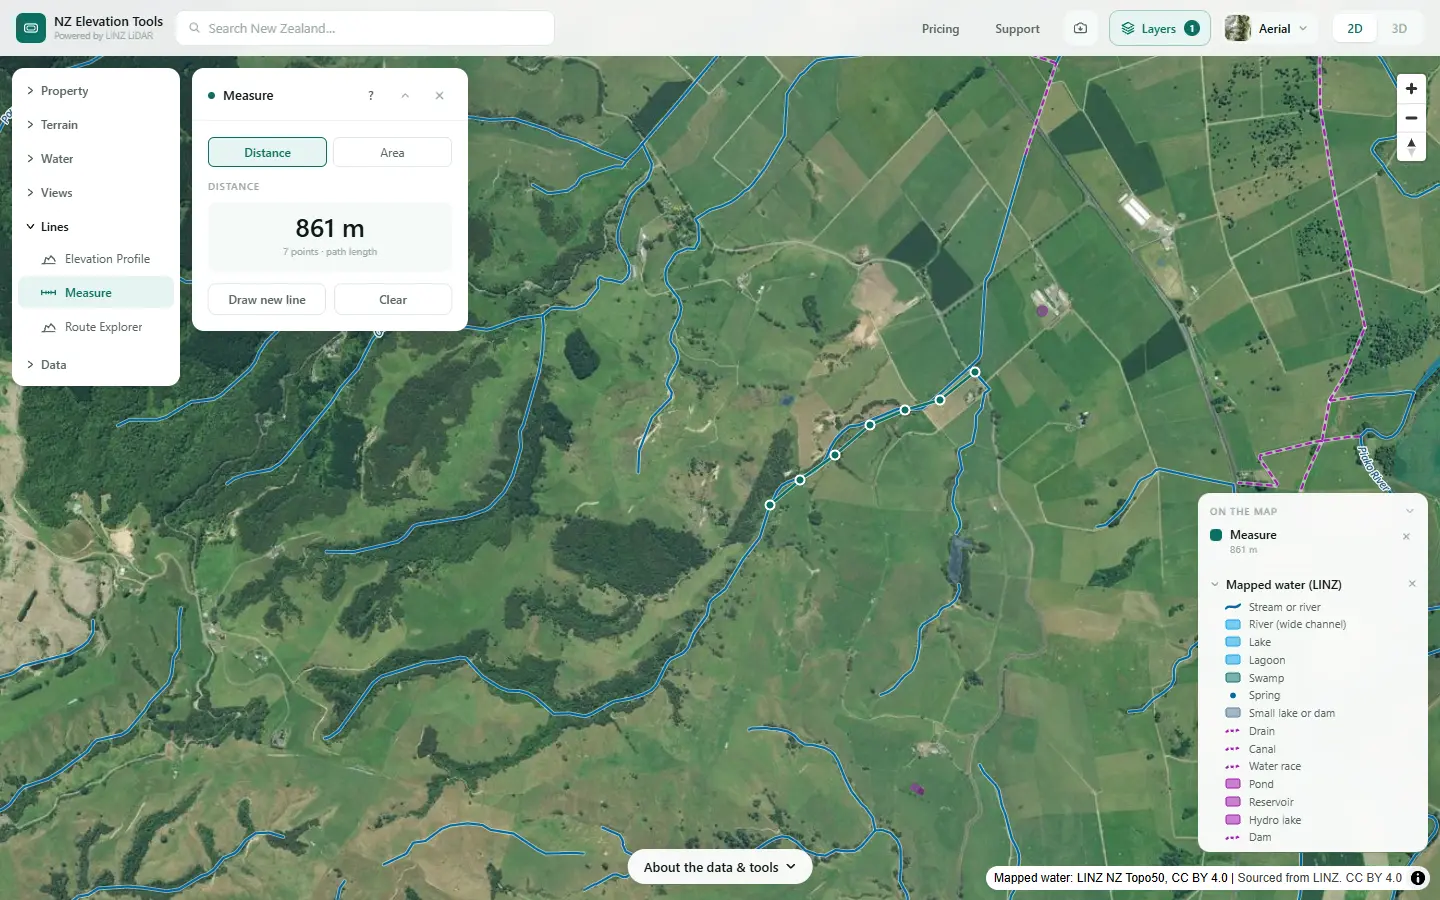
Open Measure and tap along the line you would actually fence, corner by corner. Choose Done for the length, and double it for both banks. Do it reach by reach, so you can budget and stage the work.
Allow for the slope
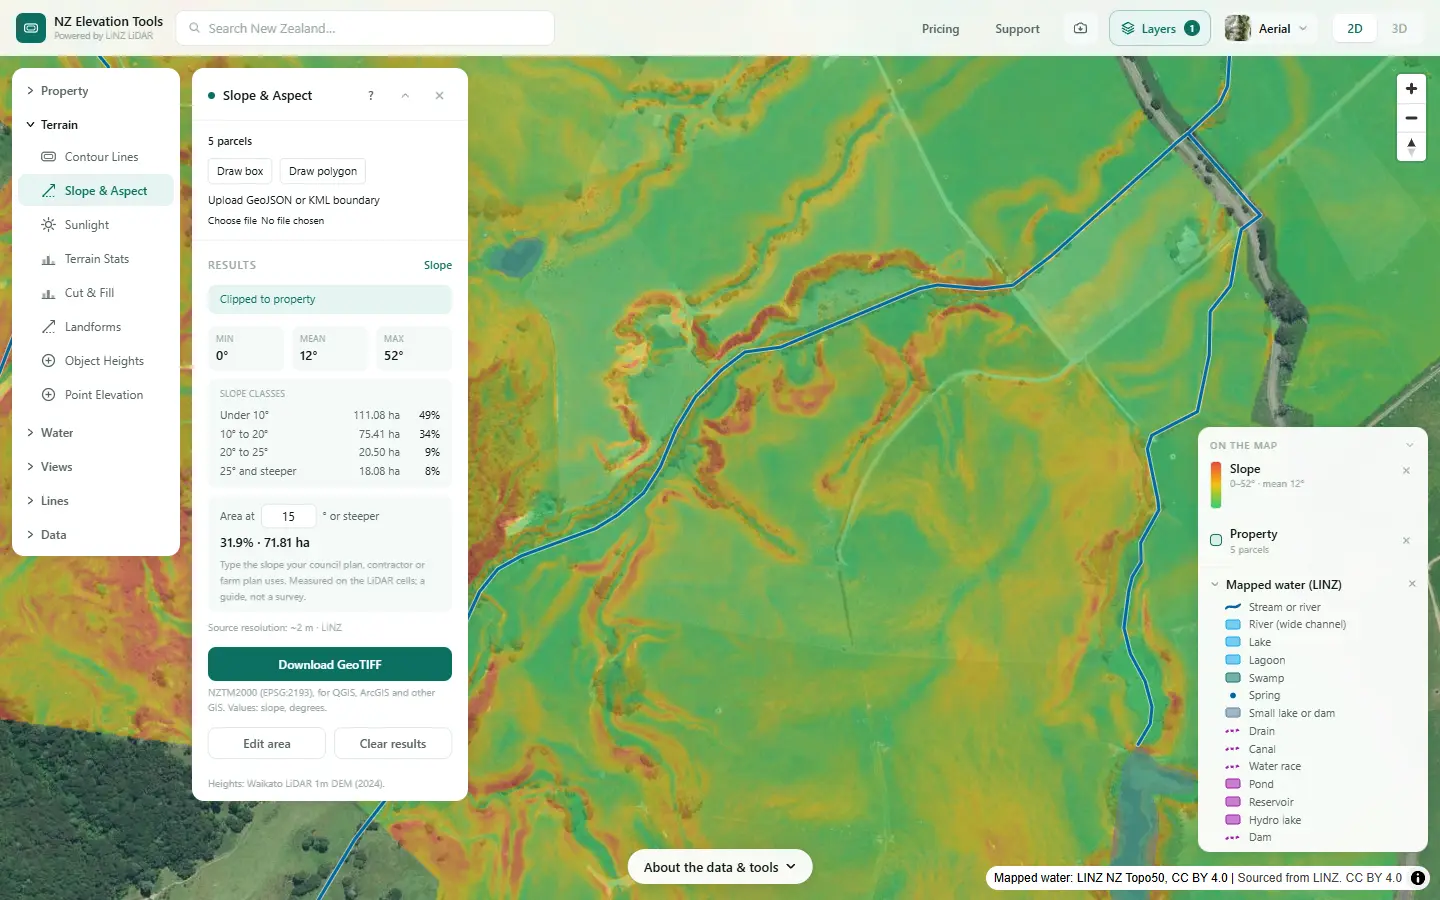
Measure gives the flat map distance. Where the fence runs across steep banks, the wire is longer: about 6% at 20° and 15% at 30°. The slope map shows where the stream banks are steep.
Mark the crossings
Every fenced stream needs crossings, which break the fence and need gates or culverts. Roads and tracks in the Layers menu shows where the mapped tracks meet water. Catchment gives the area draining to each crossing, the first number for sizing a culvert.
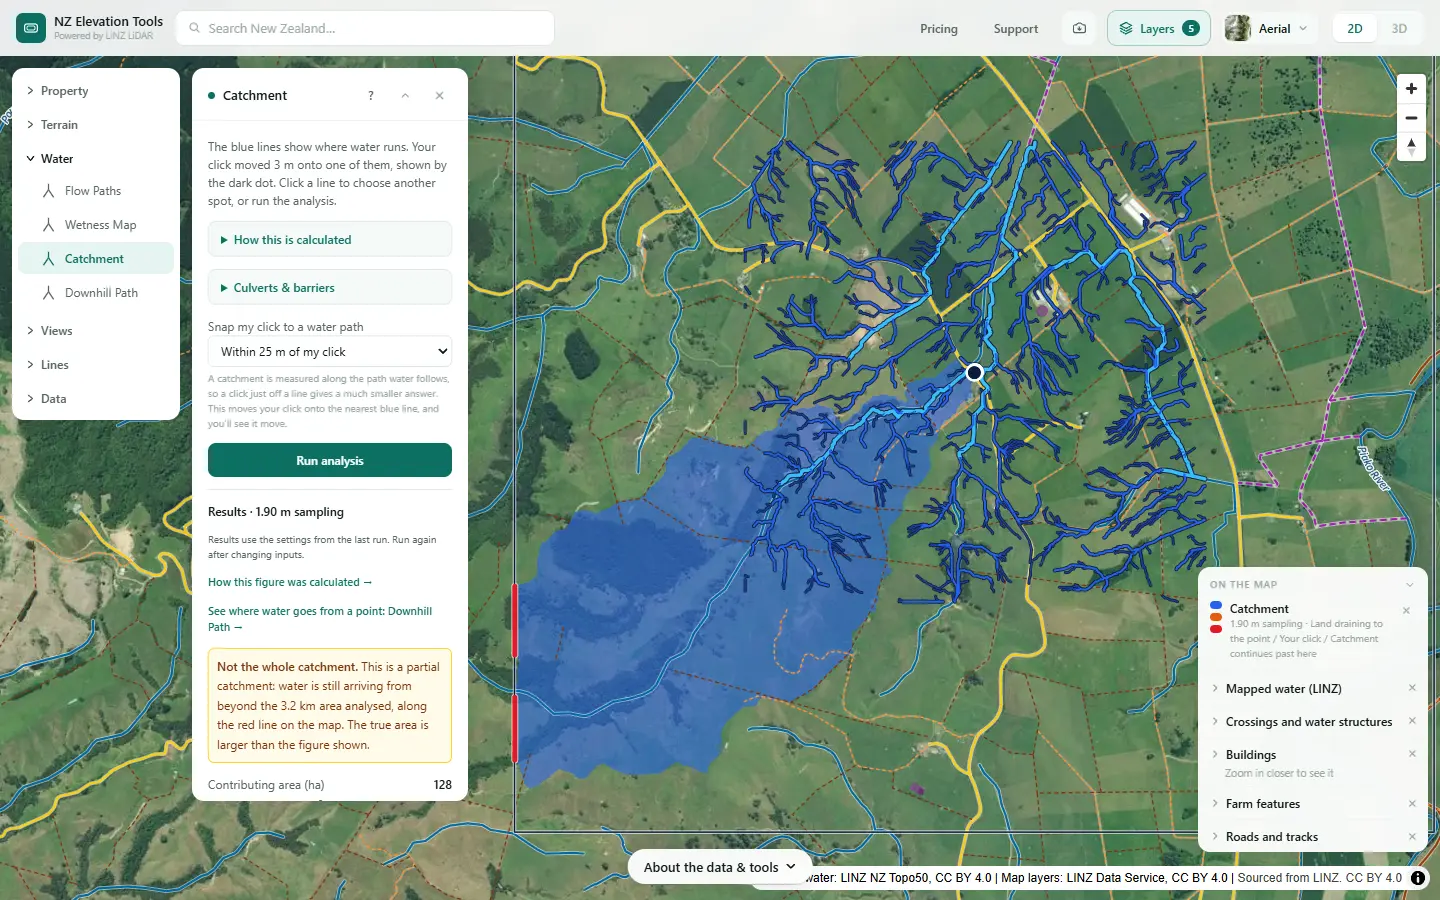
From a setback width to an area
If your plan or your council gives you a setback, the area of the strip is the length times the width. Each metre of setback along both banks of the 861 m reach above is about 1722 m², or 0.17 ha. So a 5 m strip either side of that reach takes about 0.9 ha out of grazing, and a 10 m strip about 1.7 ha. The same sum on the whole 3.9 km of mapped stream gives 0.78 ha per metre of setback.
For an exact figure, trace the strip with Measure in Area mode. The setback width itself, and which streams it applies to, come from your regional council and the national rules, which have been changing.
Hand it to the fencer or adviser
Saving the map as an image is free. With a pass, the property data ZIP holds the mapped streams as GeoJSON, KML and DXF, and Flow Paths exports the LiDAR watercourses.
What this cannot tell you
- Which streams the rules say to fence. That depends on your region, your stock and your slope. Ask the council or your adviser.
- The exact fence line. Map lines are simplified and can sit off the real channel; set the line on the ground.
- What is already fenced. The map does not know. Mark existing fences and subtract them.
- The cost. Fence type, terrain, access and gates drive it. The length is the start of the quote, not the end.
Related guides
- Natural or artificial? — and why the mapped line can be in the wrong place.
- Stream crossings and farm tracks — the gaps in the fence.
- How big should a farm wetland be?
- Farm maps for a freshwater farm plan
Screenshots from NZ Elevation Tools of a dairy and drystock farm on the edge of the Piako flats in the Waikato, with legal descriptions and owners blurred. Aerial photos and LiDAR from LINZ. Sourced from the LINZ Data Service and licensed by Regional Software Holdings Limited and Waikato Regional Council for re-use under the Creative Commons Attribution 4.0 International licence.
Frequently asked questions
How do I work out how much riparian fencing I need?
Measure the length of each stream you plan to fence, and double it for both banks. Select the farm with the Property tool and it gives a both-banks figure for the mapped streams. Measure any reach yourself by tapping along it with Measure. Add the extra for winding banks, gateways and crossings.
Why is the fence longer than the map says?
Three reasons. The map line is simplified, so a winding stream is longer on the ground. Measure gives the flat map distance, so on sloping banks the fence is longer: about 6% more at 20° and 15% more at 30°. And a fence set back from the bank follows the paddock, not the water, with corners and gateways.
Which streams do I have to fence?
That depends on the rules where you farm, the stock and the slope, and national stock exclusion rules have been changing. Your regional council or farm adviser will tell you what applies now. The map gives you the lengths, whichever streams it turns out to be.
How do I work out the area of a riparian planting strip?
Length times width. A strip one metre wide along both banks of a 1 km stream is 2,000 m², or 0.2 ha. Multiply by the setback width you are planning. Measure in Area mode gives the exact area of a strip you trace.
What about streams the map does not show?
The LINZ map leaves off many small streams. Flow Paths traces the watercourses from the LiDAR ground model, including ones the map misses, so you can see which gullies carry water and decide which to fence.