Where Is the Nitrate in My Stream Coming From?
A water test has come back high in nitrate. The stream carries everything from the land upstream, so the first job is to know what that land is, and how water gets from it to the stream.
Nitrate is the form of nitrogen that dissolves in water. It is what most farm water tests measure, and what councils track in streams and groundwater. A high result tells you nitrate is getting into the water somewhere upstream. It does not tell you where.
Nitrate mostly travels underground
The freshwater farm plan guidance keeps two routes apart: nutrient loss through run-off and nutrient loss through drainage (MfE, Developing a freshwater farm plan, appendix 5). For nitrate, drainage is usually the bigger one. Because it dissolves, nitrate moves down through the soil with the water that drains through it, especially in winter, into groundwater and tile drains. It comes out in springs, seeps and the stream bed, sometimes years later.
Phosphorus, sediment and E. coli are different: they mostly ride on the surface, in runoff. So a map of where runoff goes is the right tool for those, and only part of the answer for nitrate. What maps do well for nitrate is narrow the search: which land drains to your sample, where the drains and seeps are, and where to sample next.
Map the land draining to your sample
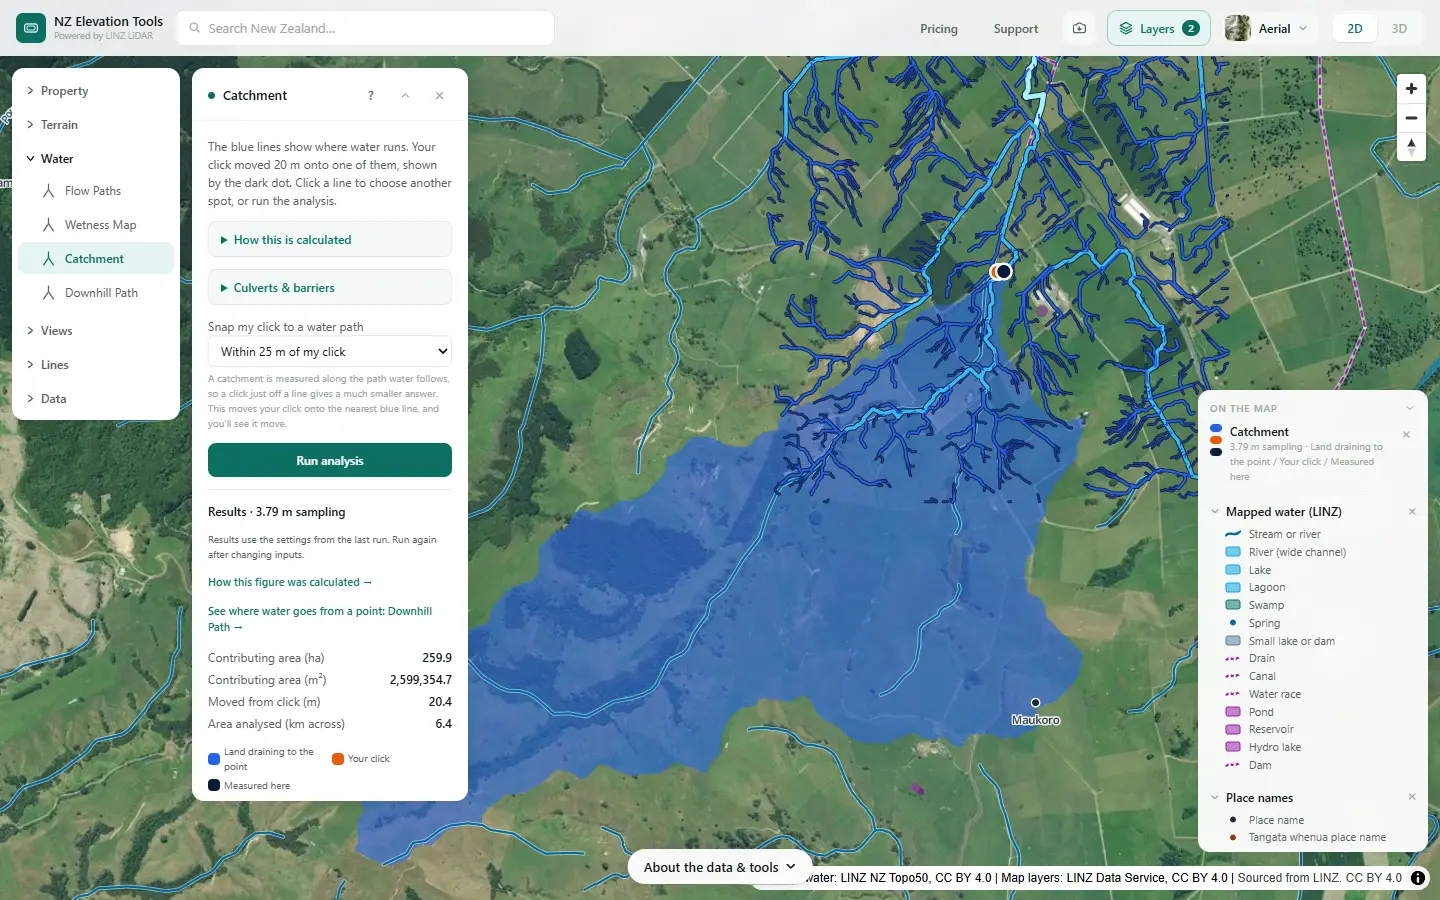
Open Catchment and click the stream where the sample was taken. It outlines all the land draining to that point, in hectares. Free to use, no login.
Open Catchment →Narrow it down in six steps
The steps are shown on a dairy and drystock farm on the edge of the Piako flats in the Waikato. Nothing here says this farm has nitrate in its stream; it is a real place to show what each step looks like. The numbers are what the tools gave on 19 November 2026.
Start at the sampling point
Open Catchment and click the stream where the sample was taken. It maps all the land draining to that point, in hectares. Everything that ends up in that sample, over the surface or through the drains, comes from inside that outline or from groundwater feeding it.
See what is in the catchment
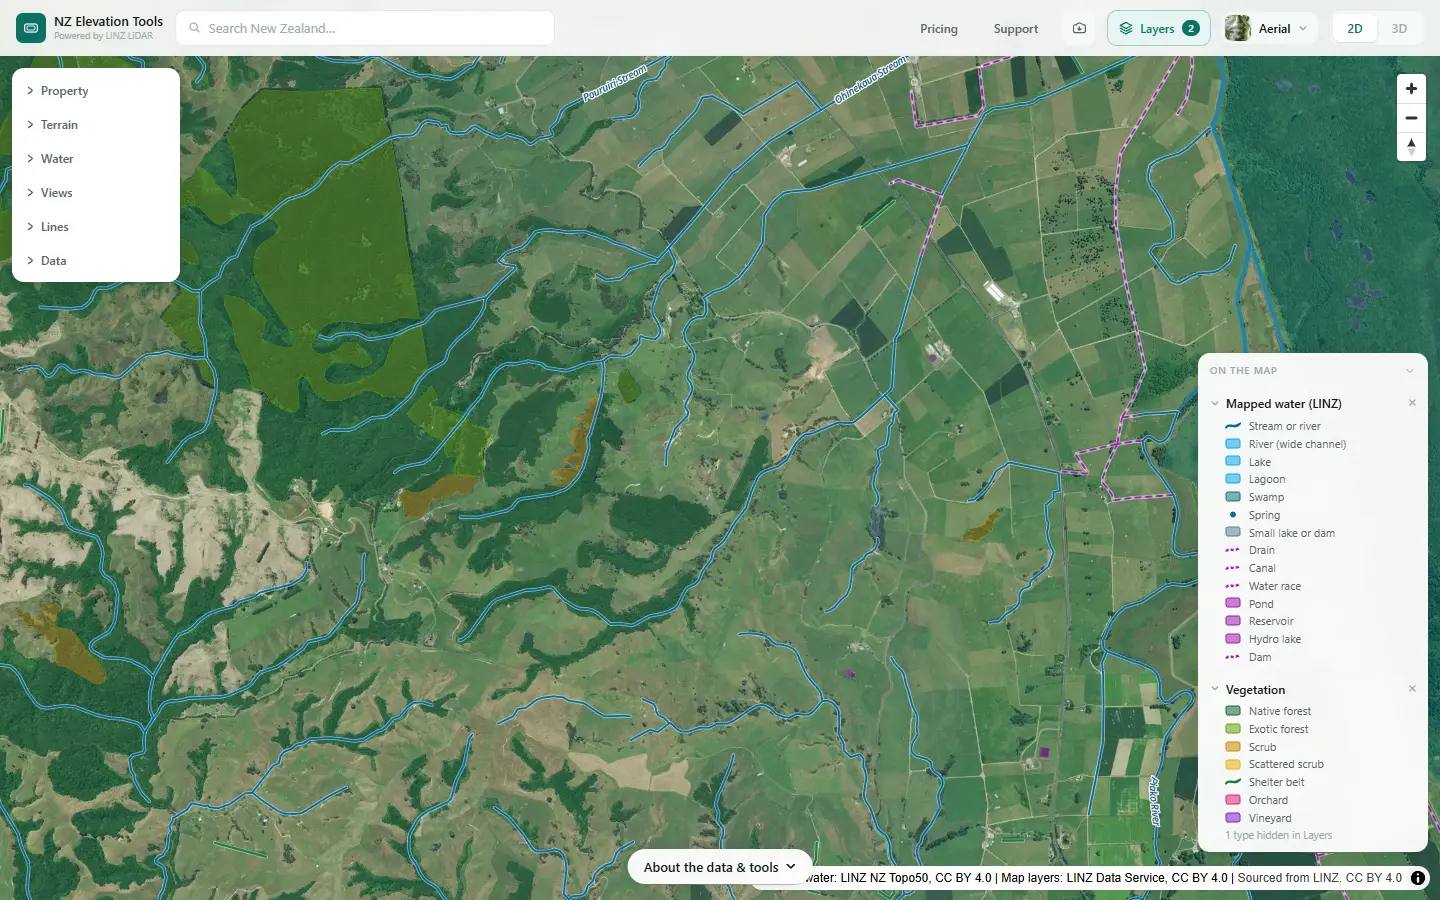
With the outline in mind, look at the land inside it. Vegetation, in the Layers menu, draws the forest, scrub and shelter belts LINZ has mapped; the aerial photo shows the pasture, crops, sheds and houses. Bush and scrub lose little nitrate; grazed and cropped ground loses more.
Look for what has changed
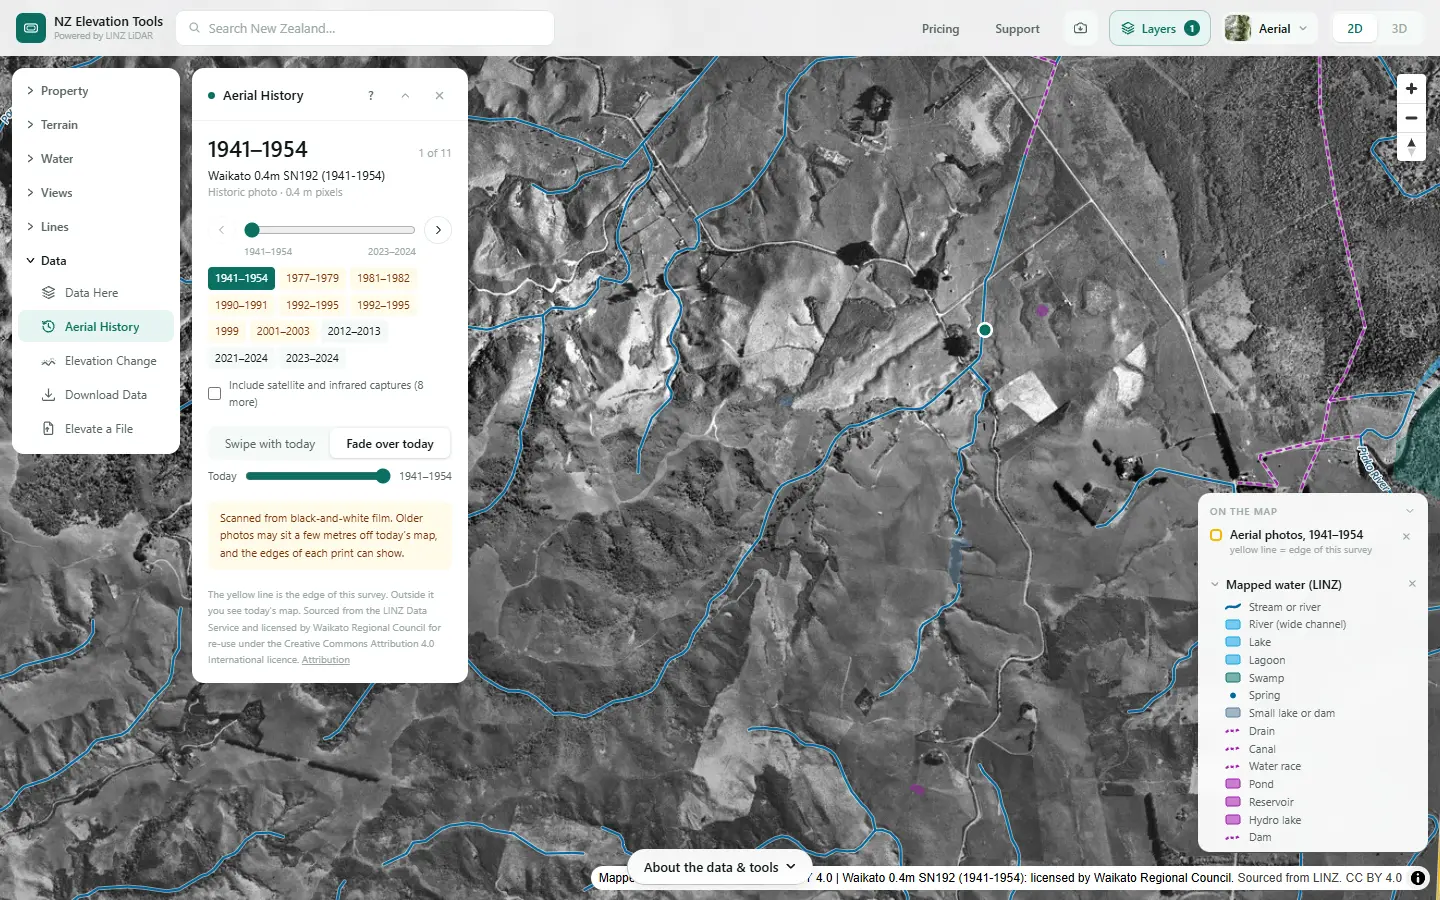
Aerial History steps back through every LINZ photo of the catchment. A conversion to dairy, a new effluent area, cleared scrub or a block that went into crop shows up by year. With slow groundwater, a change ten years ago can still be arriving in the stream.
Find the drains and the wet ground
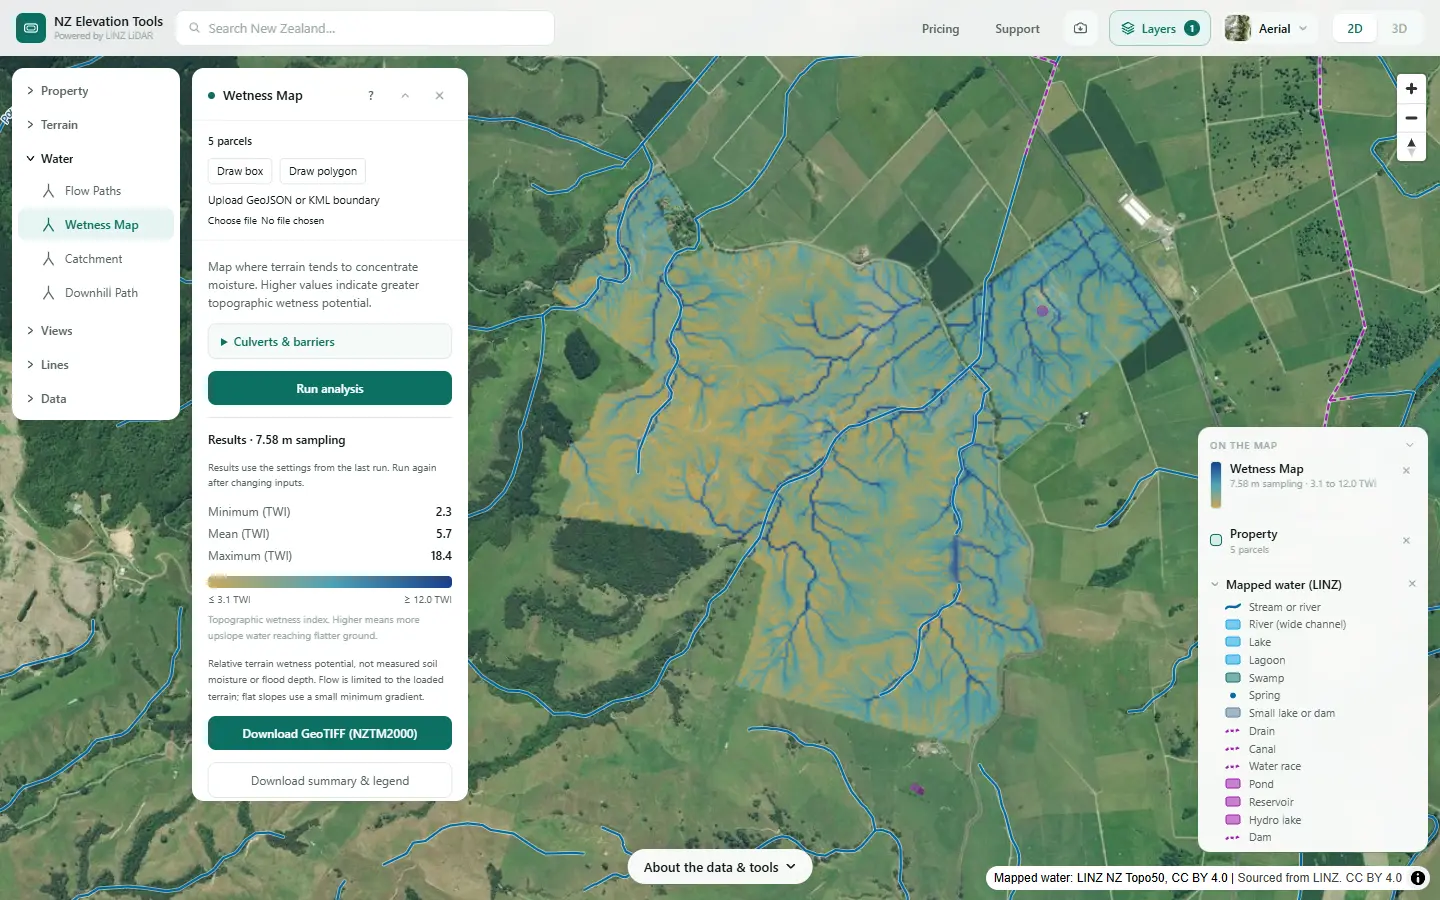
Leached nitrate travels fastest where water moves through the soil to a drain or seep. Mapped drains show in the Mapped water layer; tile drains you have to mark yourself. The Wetness Map shows the flats and hollows where water collects, which is where drains were usually laid and where seeps come out.
Trace the surface routes from hot spots
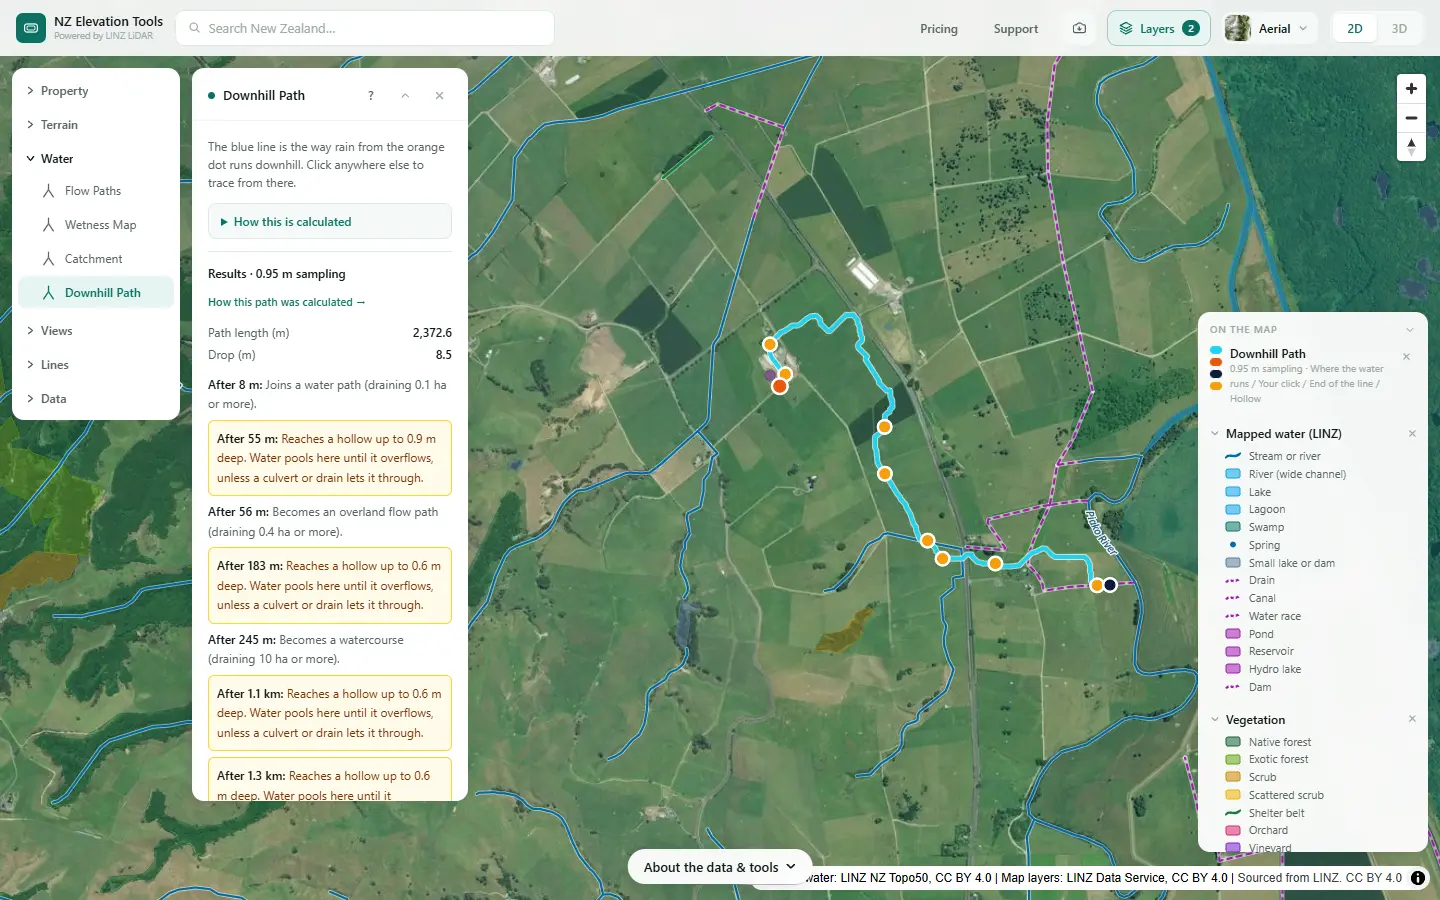
Click the effluent area, a feed pad, a winter crop paddock or a stock camp. Downhill Path shows where surface water from it runs and how far it goes before it reaches a stream. It rules surface routes in or out; it says nothing about what soaks in.
Plan the next samples
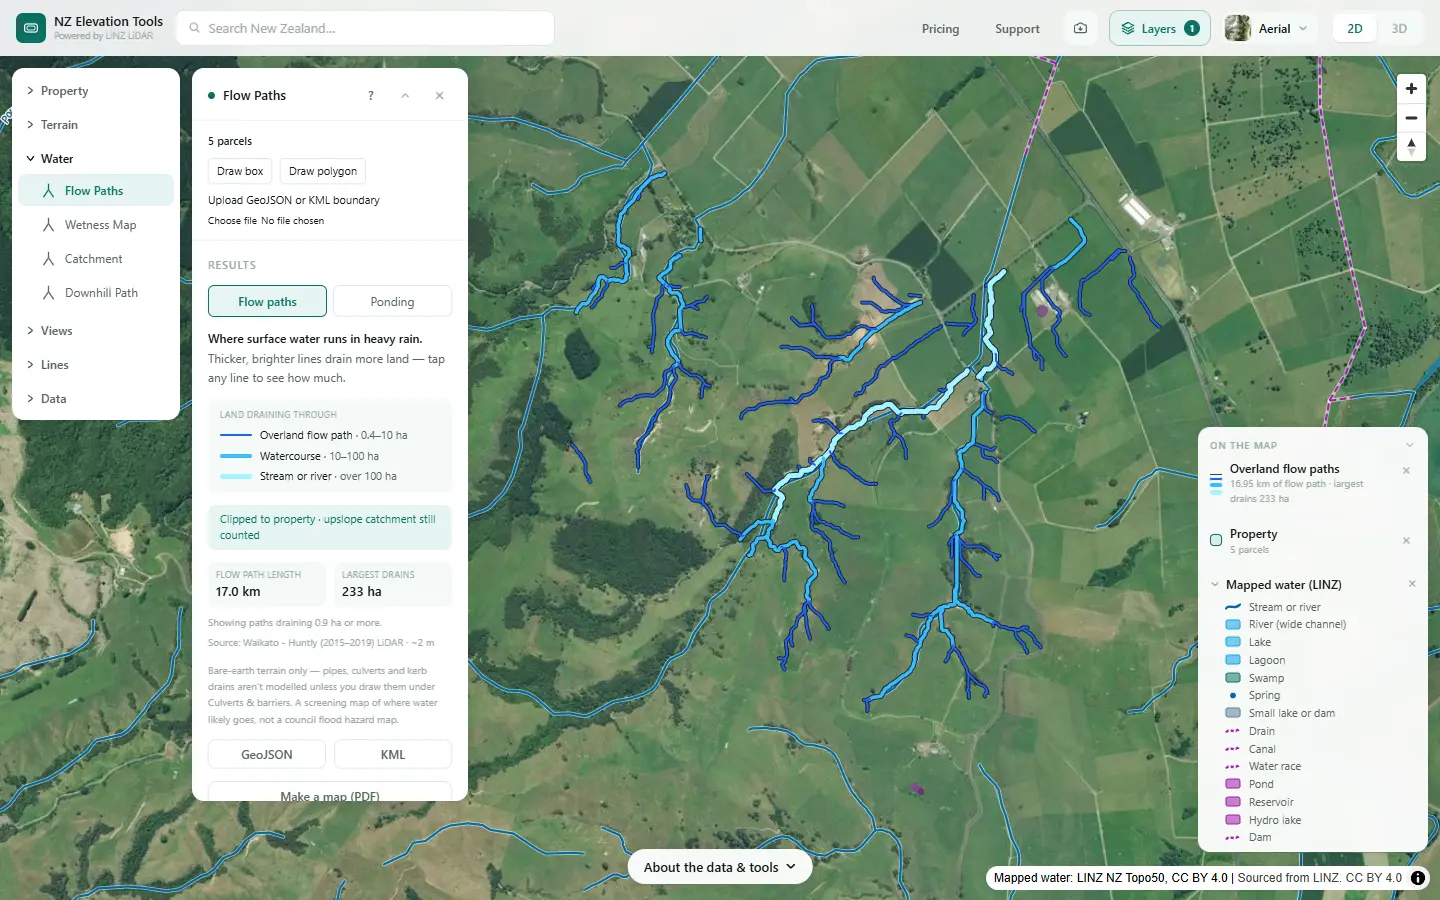
Run Flow Paths over the catchment and tap where the tributaries, drains and gullies join the stream: each shows how much land drains through it. Sample above and below the biggest joins. A step up between two samples puts the source in the land in between.
What the steps told us on this farm
A sample where the stream leaves the farm would represent about 260 ha, much of it the farm’s own hill and rolling country and some from above the boundary. The dairy shed and pond are not in that catchment by the surface route: water from beside them runs east to the Piako drains instead. So for that stream, the places to ask about first are the grazed hill and rolling paddocks, the gullies where water gathers, and any drains or springs feeding the stream on the flat. For the shed and effluent area, the sample to take would be in the drains to the east.
That is as far as maps go. The next step is a few water samples at the joins Flow Paths shows, and a conversation with the farm adviser and the council about groundwater.
Take it further
Saving the maps as images is free. With a pass, the catchment outline exports as DXF, GeoJSON or KML, and the flow paths as GeoJSON or KML, to mark sampling sites on.
What this cannot tell you
- How much nitrate there is, or where it is lost. Nothing here measures or models nitrogen. Water tests do the first; nutrient budgets such as OVERSEER and an adviser do the second.
- Where the groundwater goes. Water that soaks in can travel underground to a different stream or a spring kilometres away. Ask the council what is known about groundwater in your area.
- Where the tile drains run. They are not in the ground model. Mark the ones you know.
- How old the water is. A stream can carry nitrate from land use years ago. The photos show the history; the council may know the groundwater age.
- Whether a result breaches a limit. Limits and targets are set by regional councils and national policy. Ask them.
Related guides
- Run-off or drainage? — nitrogen, phosphorus, sediment and E. coli, and the route each takes.
- What catchment am I in? — the land your stream drains.
- Critical source areas — where surface runoff gathers.
- Mapping farm drainage — drains, wet ground and ponding.
- How big should a farm wetland be? — a wetland on a drain can take up some of the nitrate.
Screenshots from NZ Elevation Tools of a dairy and drystock farm on the edge of the Piako flats in the Waikato, with legal descriptions and owners blurred. Aerial photos and LiDAR from LINZ. Sourced from the LINZ Data Service and licensed by Regional Software Holdings Limited and Waikato Regional Council for re-use under the Creative Commons Attribution 4.0 International licence.
Frequently asked questions
How does nitrate get into a stream?
Mostly from below. Nitrate dissolves in water and moves down through the soil with drainage, into groundwater and tile drains, and comes out in springs, seeps and the stream bed. Some arrives over the surface too, from effluent, fertiliser or dung washed off in heavy rain, but on most farms leaching is the main route.
Can a map show where nitrate is coming from?
Not directly. Nothing here measures nitrate. A map shows which land drains to the point you sampled, where the drains and wet ground are, and which way surface water runs from a hot spot. That narrows down where to look and where to sample next. Water tests, ideally at several points, tell you the rest.
Where does most nitrate on a farm come from?
On grazed pasture, much of the nitrogen that leaches comes from urine patches, where far more nitrogen lands in one spot than the grass can use. Effluent areas, winter crop paddocks, feed pads and heavily fertilised ground add to it. Free-draining soils and wet winters move more of it down.
Why is nitrate still high after we changed things?
Groundwater can take a long time to reach a stream. In some catchments the water coming out of springs today soaked in years or decades ago, so a change on the land can take a long time to show in the water. Your regional council may know the groundwater age in your area.
Where should I take water samples?
At the point you care about, and then above and below each tributary, drain or spring that joins the stream. A rise between two samples puts the source in the land draining in between. Flow Paths and Catchment show where those joins are and how much land feeds each one.
Is the groundwater catchment the same as the surface catchment?
Not always. Water that soaks in can flow underground in a different direction to the surface, especially in gravels and pumice. The surface catchment is the best starting point you can map, but your regional council’s groundwater information is the one to check.