Finding Erosion and Slips on Your Farm from LiDAR
Where is the land steep enough to slip, where does water gather on it, and where has the ground already moved? LiDAR answers all three, and on some farms it can measure the change.
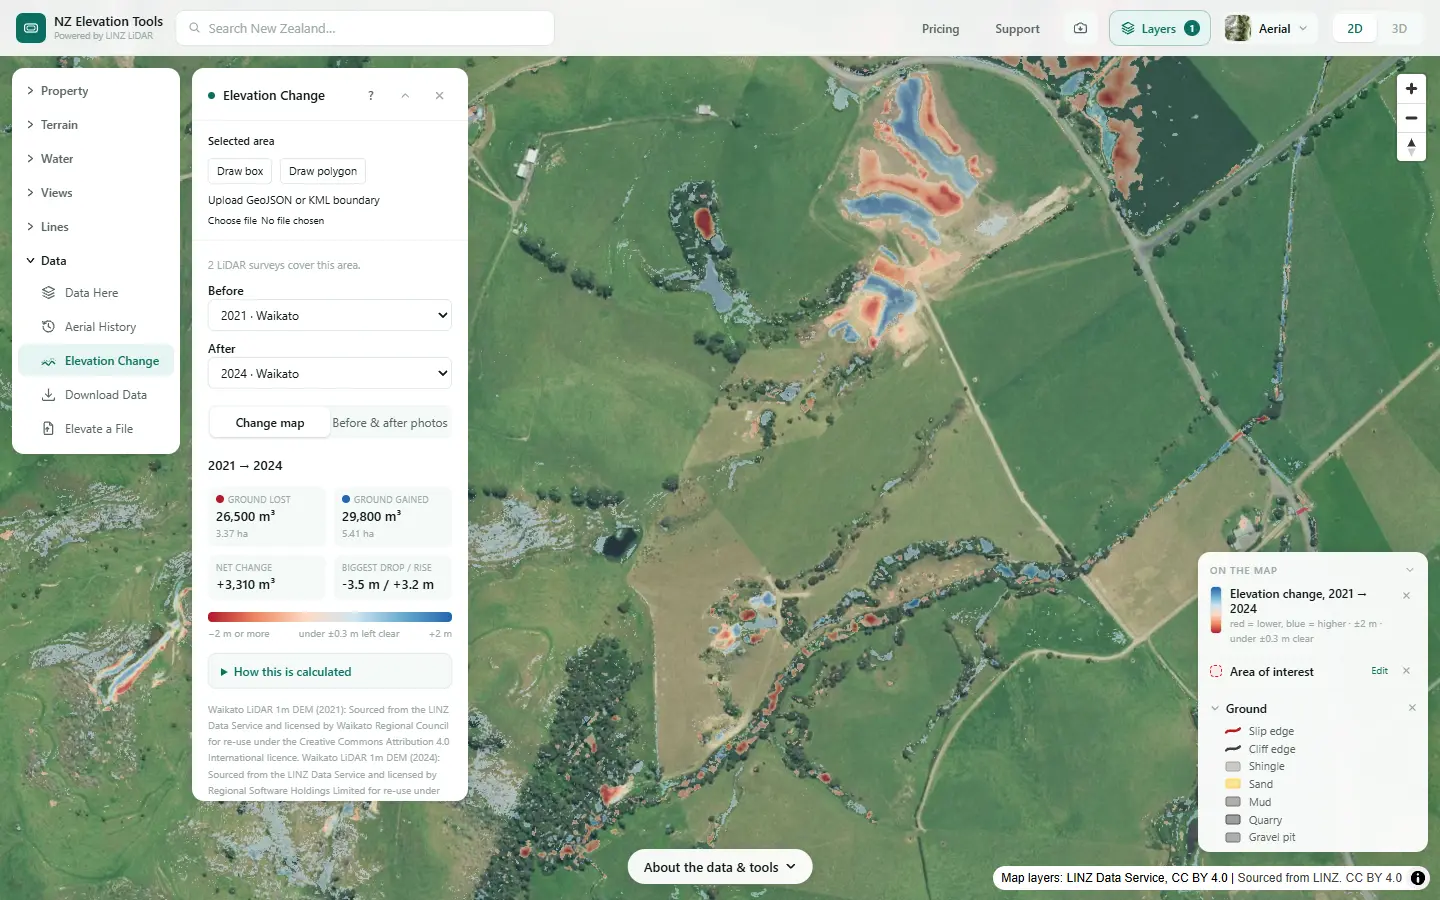
A freshwater farm plan maps landform, including slope and any soil erosion control plantings or works, and the guidance lists mass movement, surface and streambank erosion among the land’s inherent vulnerabilities (MfE, Developing a freshwater farm plan). Sediment from slips and bare ground is one of the biggest things hill country loses to water.
See how much of your farm is steep
Select the farm and run Slope & Aspect. Type any slope to get the hectares at least that steep. Free to use, no login.
Open Slope & Aspect →Find it in five steps
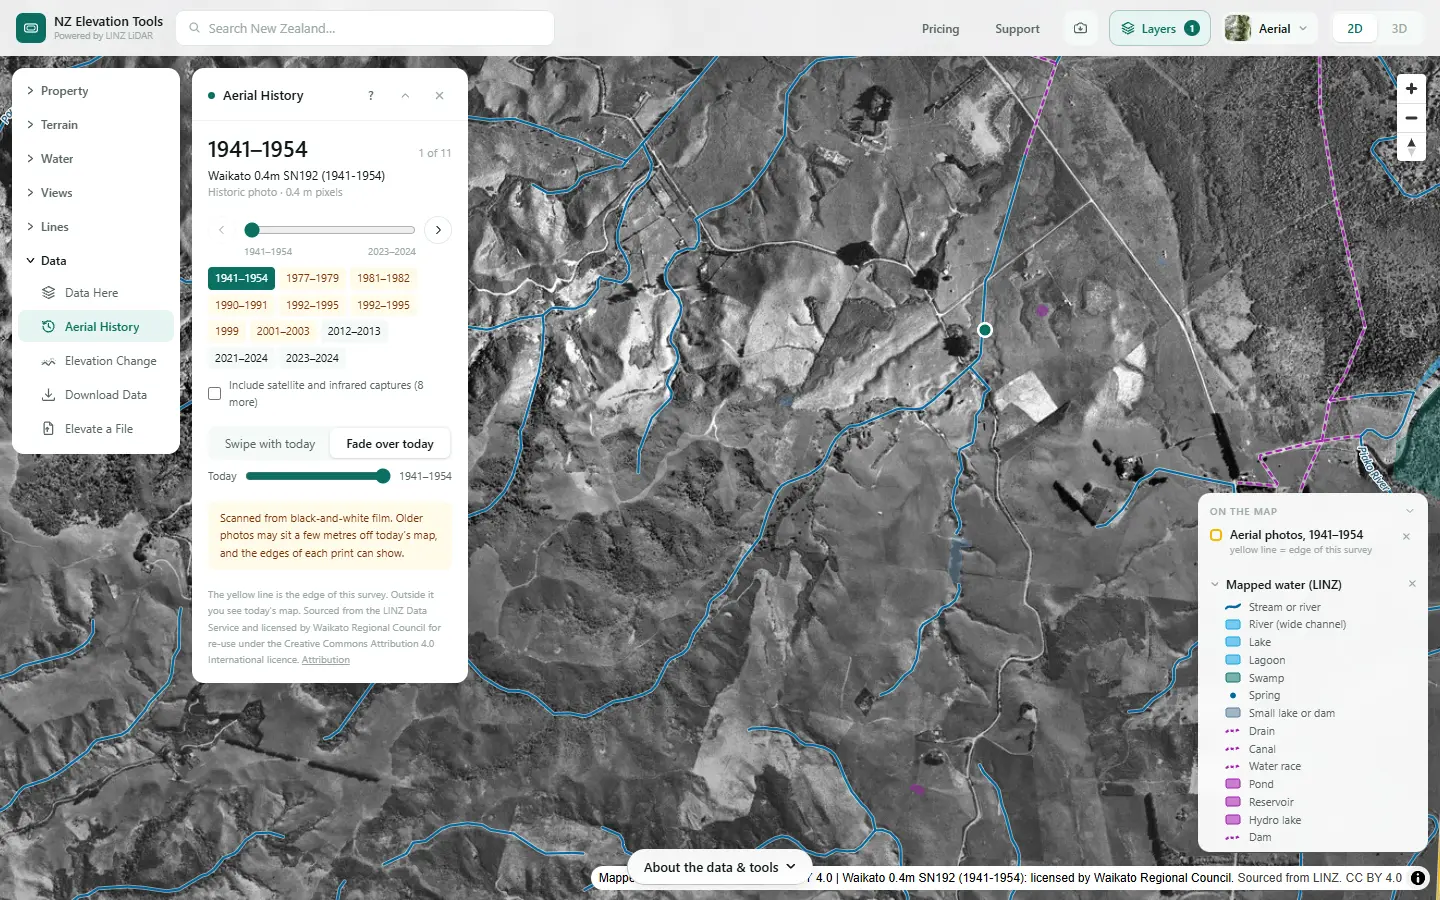
Shown on a dairy and drystock farm on the edge of the Piako flats in the Waikato, with the numbers the tools gave on 19 November 2026.
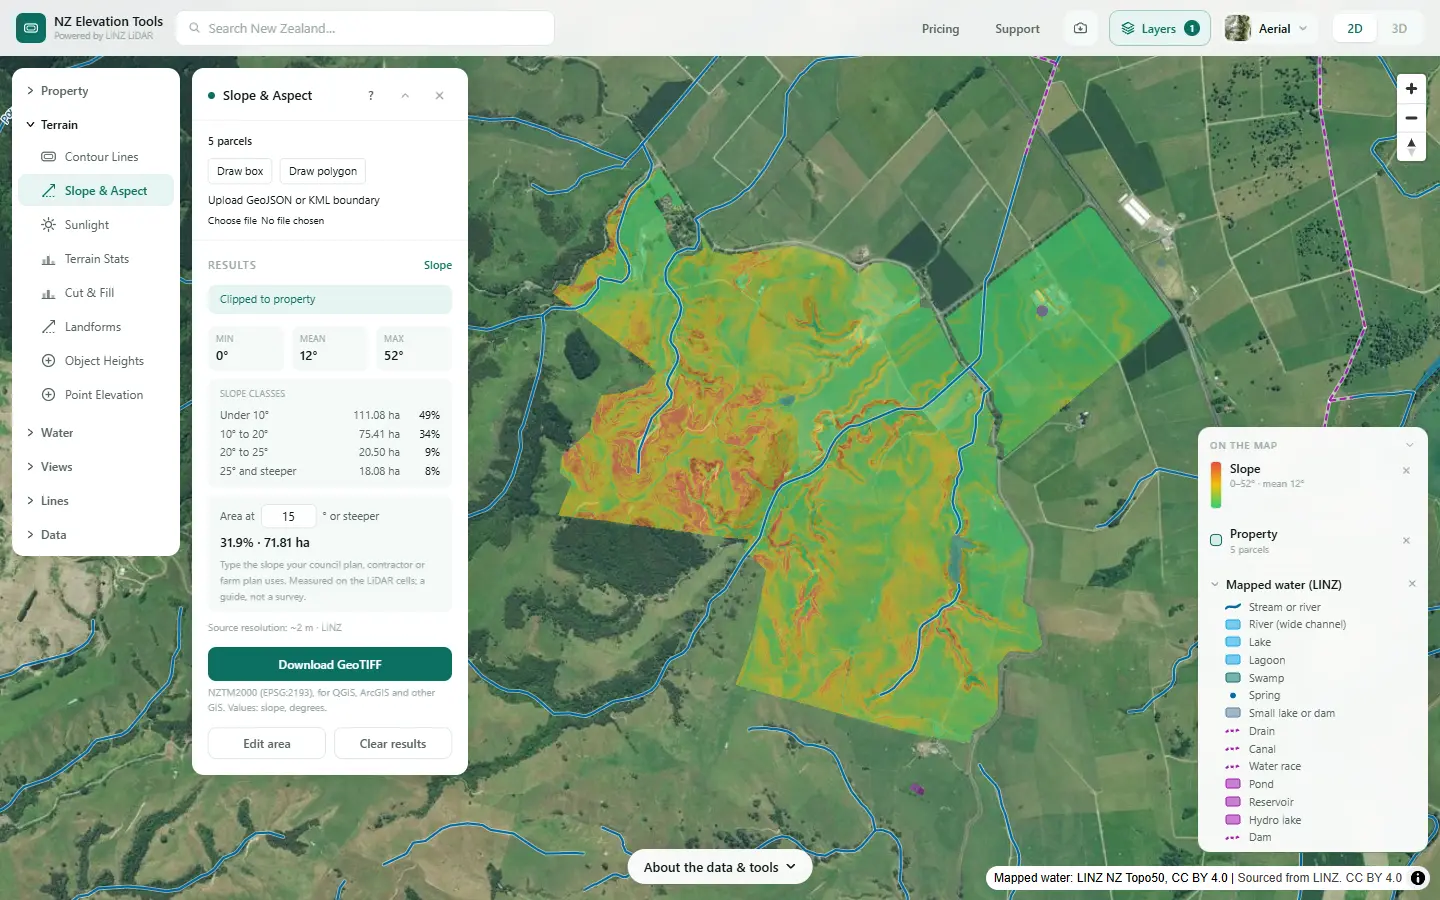
Map the steep ground
Select the farm and run Slope & Aspect. Type the slope you care about, 25° say, to see how much of the farm is at least that steep and where it is. On hill country it is often the short faces down into the gullies, not whole paddocks.
Find the gully heads and hollows
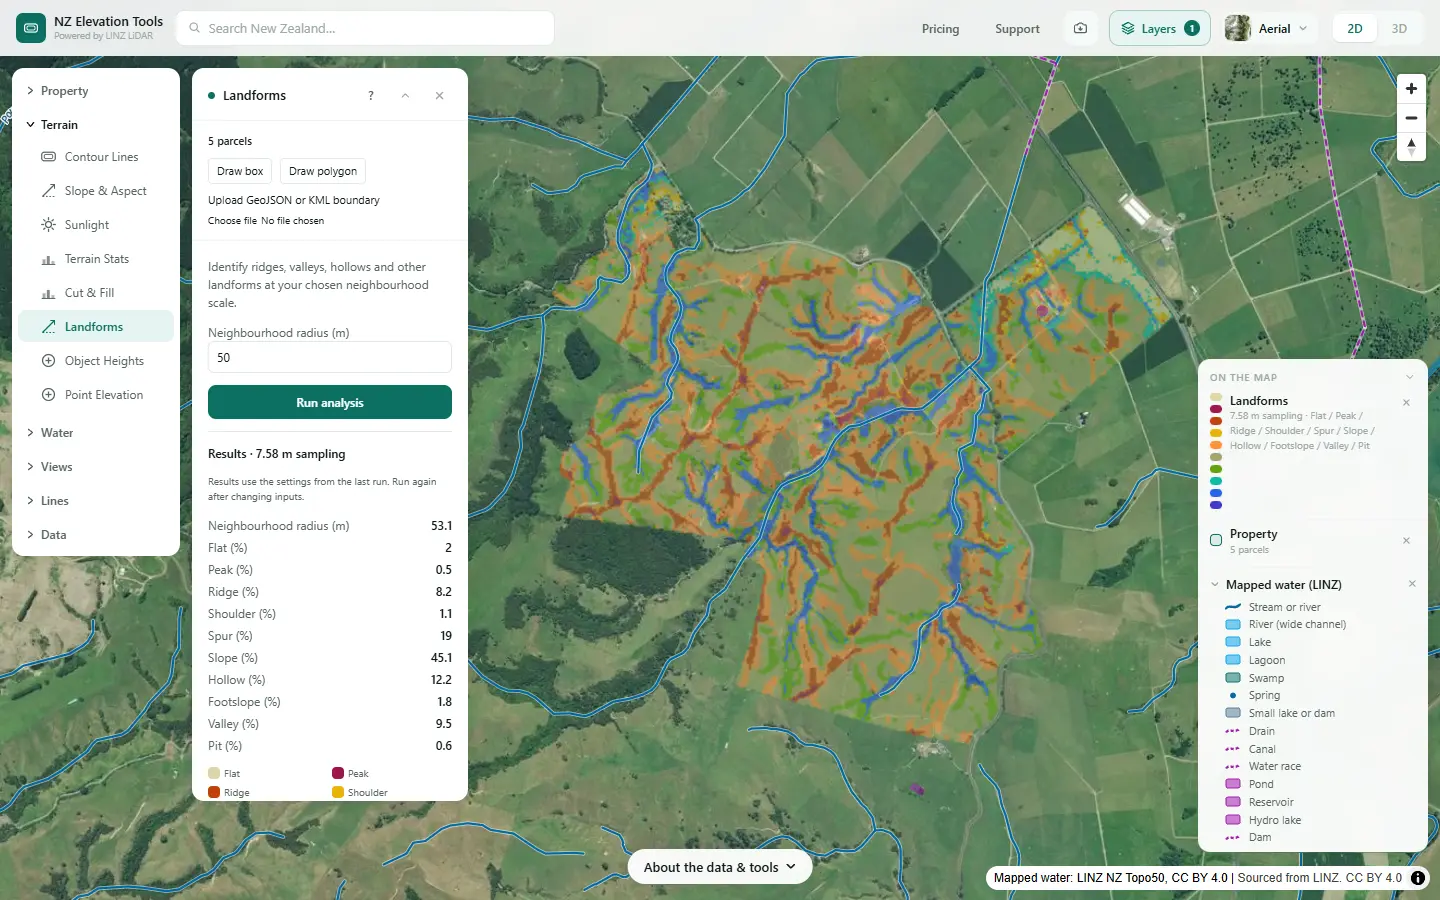
Run Landforms. Hollows and valleys gather water; spurs and ridges shed it. Many slips start where a steep face meets a hollow that concentrates water, at the head of a gully.
Check what LINZ has mapped
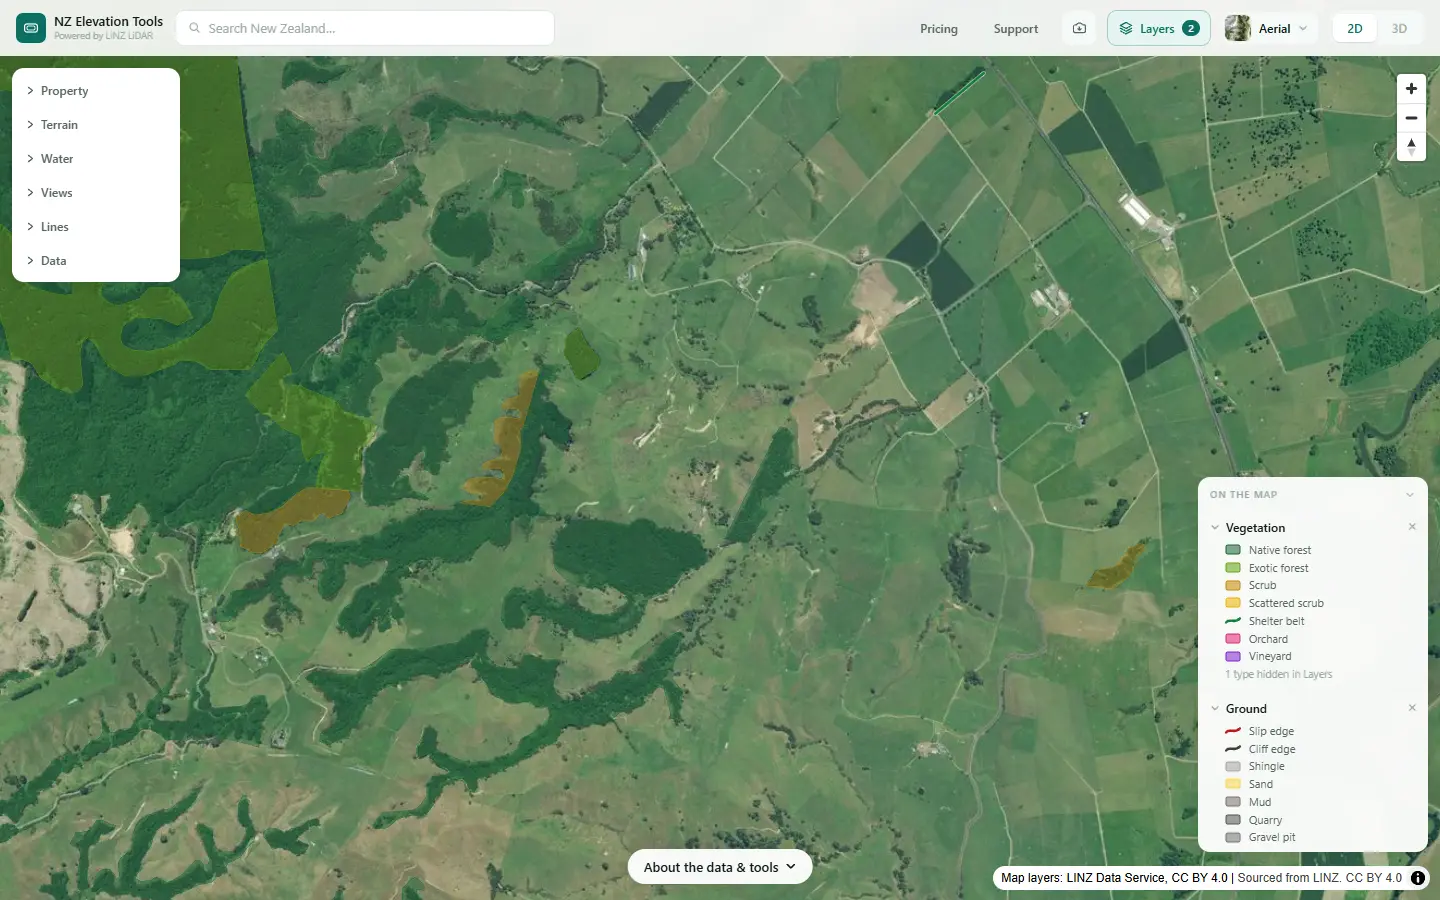
Switch on Ground in the Layers menu. It draws the slips, cliffs, quarries and bare ground LINZ mapped on the 1:50,000 topographic map. Vegetation shows the forest and scrub, which often marks land too steep or unstable for pasture.
Look back at the old photos
Step through the photos. Slips show as bare scars that green over in later years; a face that slips again and again is a place for planting. Storm years are worth checking in particular.
See where the ground moved
Where LINZ has flown the land twice, Elevation Change compares the two surveys and shades where the ground went down in red and up in blue, with the volumes. A slip is a red scar above a blue deposit. Areas can be up to 2 km across, so do a block at a time.
What it showed on this farm
The steep ground is the gully sides, about 18 ha at 25° or more, with gully heads reaching up into the paddocks. LINZ maps no slips here. Between the 2021 and 2024 surveys the largest change is earthworks: a block of cut and fill, the kind of thing Elevation Change measures well. If a face had slipped in those years it would show the same way, as a red scar above a blue lobe.
Plan the planting
Saving the maps as images is free. With a pass, the slope grid and the change map export as GeoTIFF, for a land management adviser.
What this cannot tell you
- The erosion risk. Geology, soil, rainfall and vegetation decide whether steep land slips. Nothing here models that.
- Slips before the first LiDAR survey. Elevation Change only covers the years between two surveys. Older slips show in photos and in the shape of the ground.
- Small changes. Under 0.3 m is left out as survey noise. Bush, water and steep faces are the least reliable.
- What to plant. Ask your regional council’s land management advisers.
Related guides
- Before and after in LiDAR: Cyclone Gabrielle and Kaikōura
- Slope maps
- How to divide your farm into land units
- Run-off or drainage?
Screenshots from NZ Elevation Tools of a dairy and drystock farm on the edge of the Piako flats in the Waikato, with legal descriptions and owners blurred. Aerial photos and LiDAR from LINZ. Sourced from the LINZ Data Service and licensed by Regional Software Holdings Limited and Waikato Regional Council for re-use under the Creative Commons Attribution 4.0 International licence.
Frequently asked questions
How do I find the erosion-prone land on my farm?
Start with slope: the steep faces are where slips and surface erosion start. Add landform for the hollows and gully heads that gather water, which is where many slips begin. Then check the history: old aerial photos show past slips that have grassed over, and where LINZ has flown the land twice, Elevation Change shows where the ground has actually moved.
Can LiDAR find old slips?
Often. A slip leaves a scar and a lobe of debris that a 1 m ground model shows even after it has grassed over, especially on the slope and landform maps and in shaded relief. Comparing two LiDAR surveys shows slips that happened between them, with the volume of ground moved.
What does Elevation Change actually show?
Where the ground surface went down or up between two LINZ LiDAR surveys, cell by cell, with the volume lost and gained. Slips show as a red scar above a blue deposit. Earthworks, quarrying and silt from floods show too. Changes under 0.3 m are left out as survey noise, and water, dense bush and steep faces are the least reliable.
Where should erosion control planting go?
Usually on the steepest, most slip-prone faces, gully heads and stream banks. Your regional council’s land management advisers often help plan it, and some councils fund poles and plants. The maps show where the steep, wet and moving ground is; the adviser decides what to plant.