How to Divide Your Farm into Land Units
Every freshwater farm plan starts by splitting the farm into land units. Most of what decides where the lines go is the shape of the land, and that you can map from LiDAR. Here it is, step by step, on a real farm.
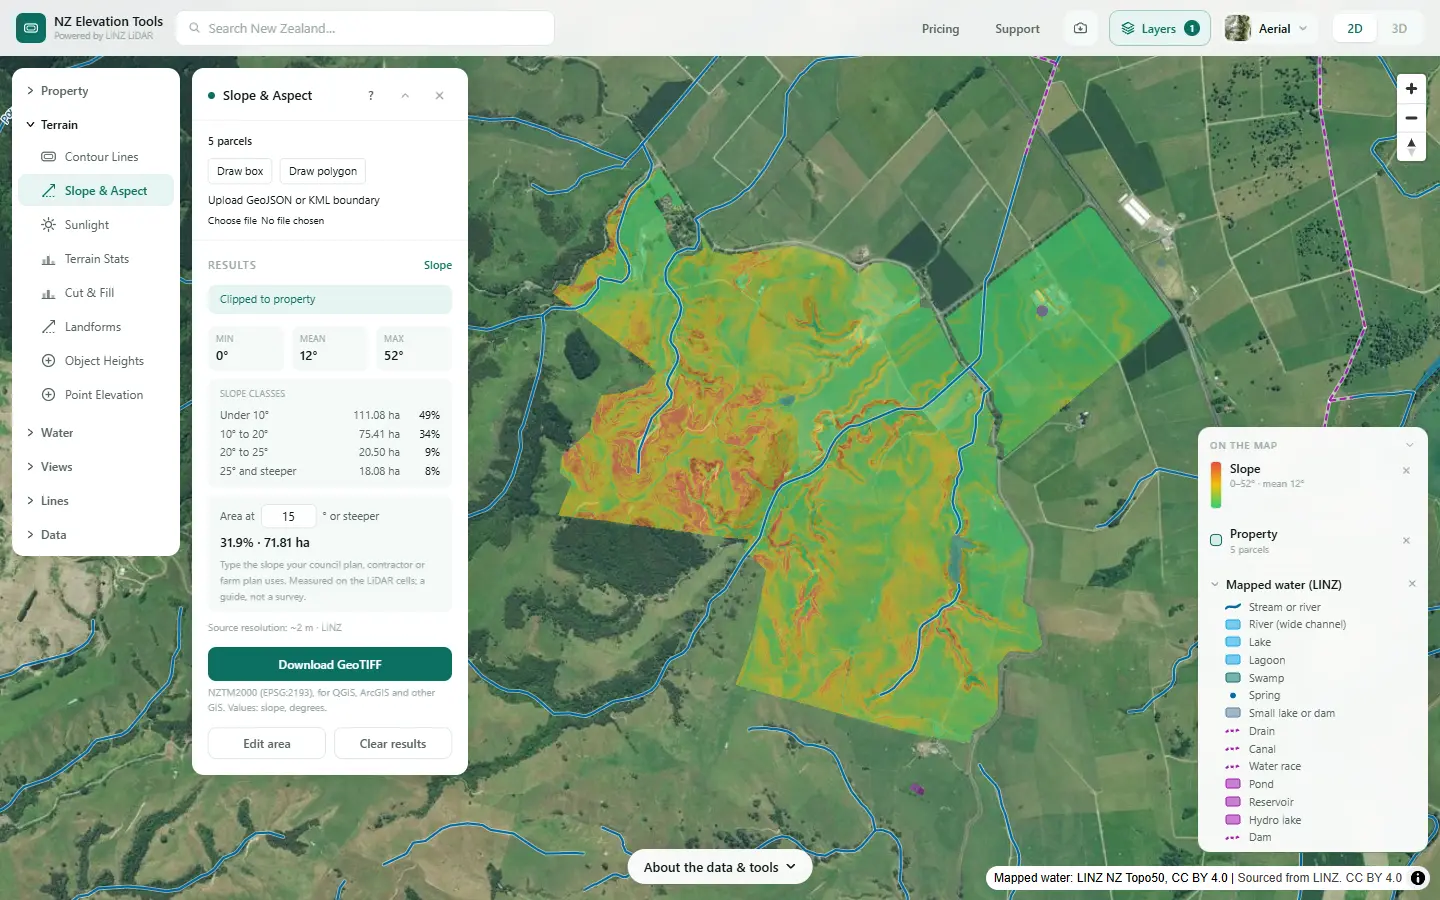
The farm plan guidance defines a land unit as “an area of contiguous or non-contiguous land with similar biophysical features”, and asks you to identify, map and describe them (MfE, Developing a freshwater farm plan, section 3.3). In plain words: group the parts of the farm that behave the same, even if they are not side by side, and keep the number of groups small.
The features the guidance lists for deciding them are:
- Soil type, heavy or free-draining.
- Landform: slope, aspect and the underlying geology.
- Climate, especially rainfall.
- Irrigation, where there is any.
- Land drainage, surface and sub-surface.
Landform and drainage are terrain questions, and the LINZ LiDAR ground model answers them for most farms in New Zealand. Soil comes from S-map. Climate and irrigation you already know.
Why the land units matter
The rest of the plan hangs off them. For each unit you describe its inherent vulnerabilities, the risks to water that come from the land itself, then what is farmed on it and the risks that creates together. Steep siltstone in high rainfall slips and sends sediment to the stream. Free-draining soil over shallow groundwater leaches nitrogen. Heavy, drained soil loses nutrients and bacteria through the drains. Get the units right and those risks sort themselves into the right places.
Start with the slope classes
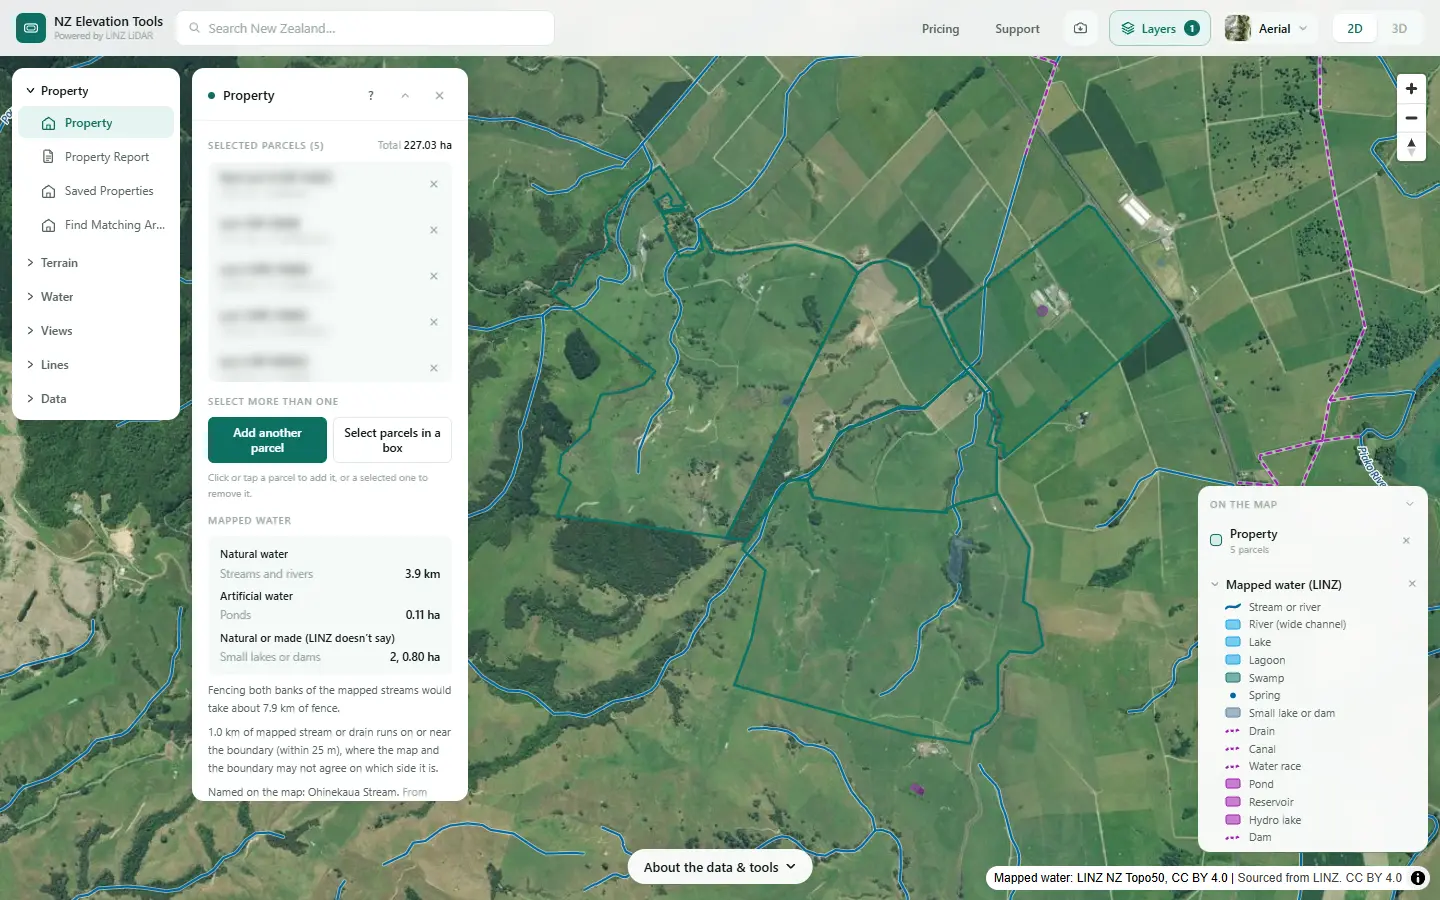
Select the farm and run Slope & Aspect. The panel gives the hectares in each slope class, and the share at any slope you type. Free to use, no login.
Open Slope & Aspect →Map them in eight steps
The example is a dairy and drystock farm on the edge of the Piako flats in the Waikato: five neighbouring titles, 227 ha, from a dairy platform on the flat up into hill country. The numbers are what the tools gave on 19 November 2026.
Load the whole farm
Search the address, click the title and turn on Add another parcel to take the rest, up to 25 titles. Note any leased or licensed land, which a farm plan also maps. Every tool after this works on the farm boundary.
Split it by slope
Run Slope & Aspect. The panel lists the area in four slope classes, and you can type any slope to see how much of the farm is that steep or steeper, for whatever break your adviser uses. This is usually the first cut: flats, rolling, hill, steep.
Add the landform
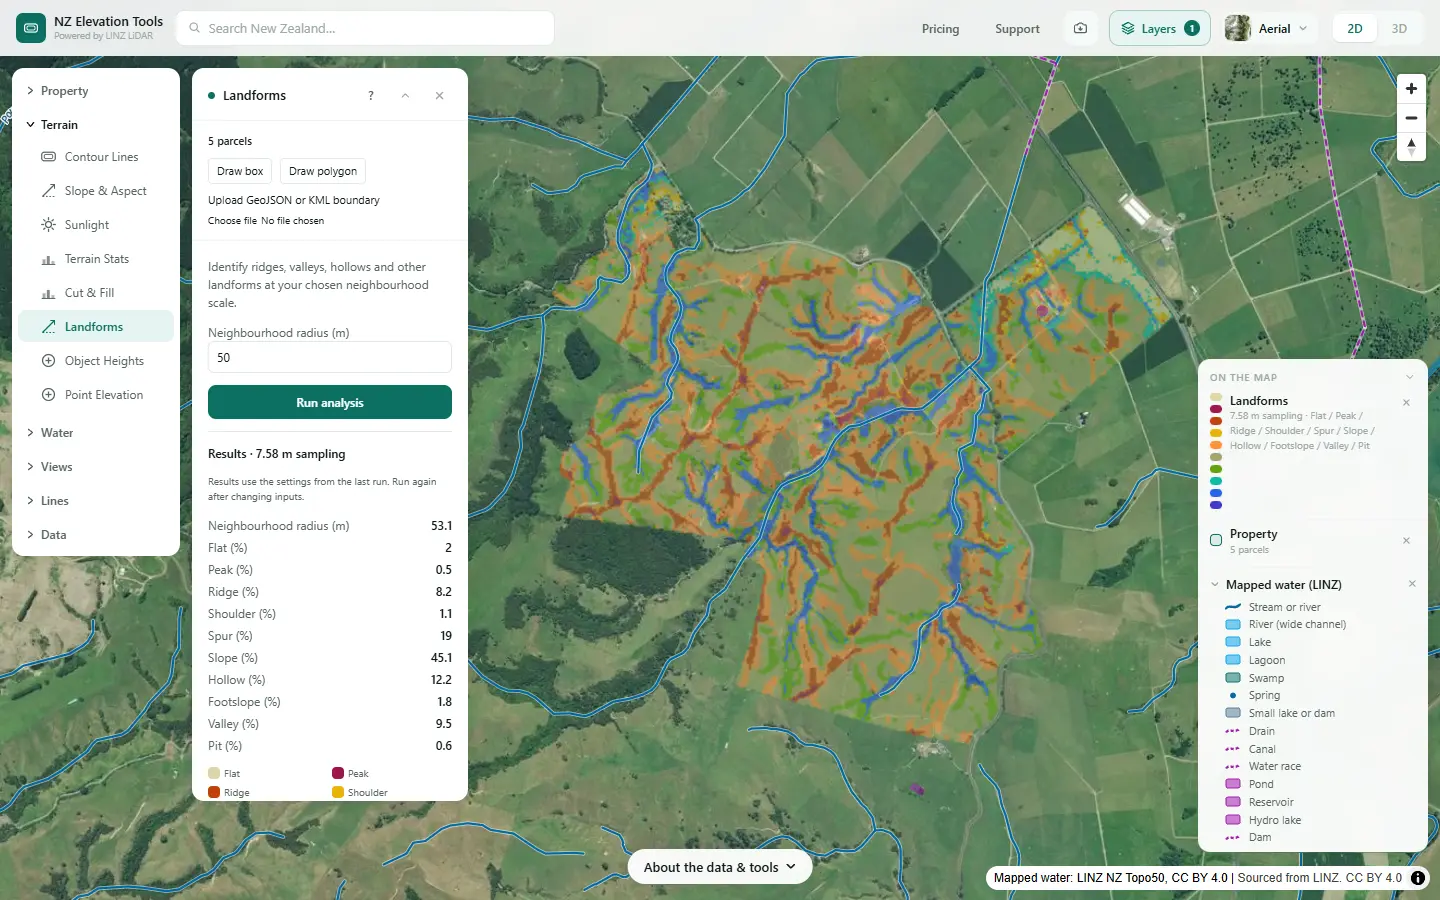
Landforms sorts the ground into ridges, spurs, slopes, hollows, valleys and flats. It picks out the hollows and gullies where water gathers, and the spurs and ridges that shed it, which slope alone does not.
Find the wet ground and the drainage
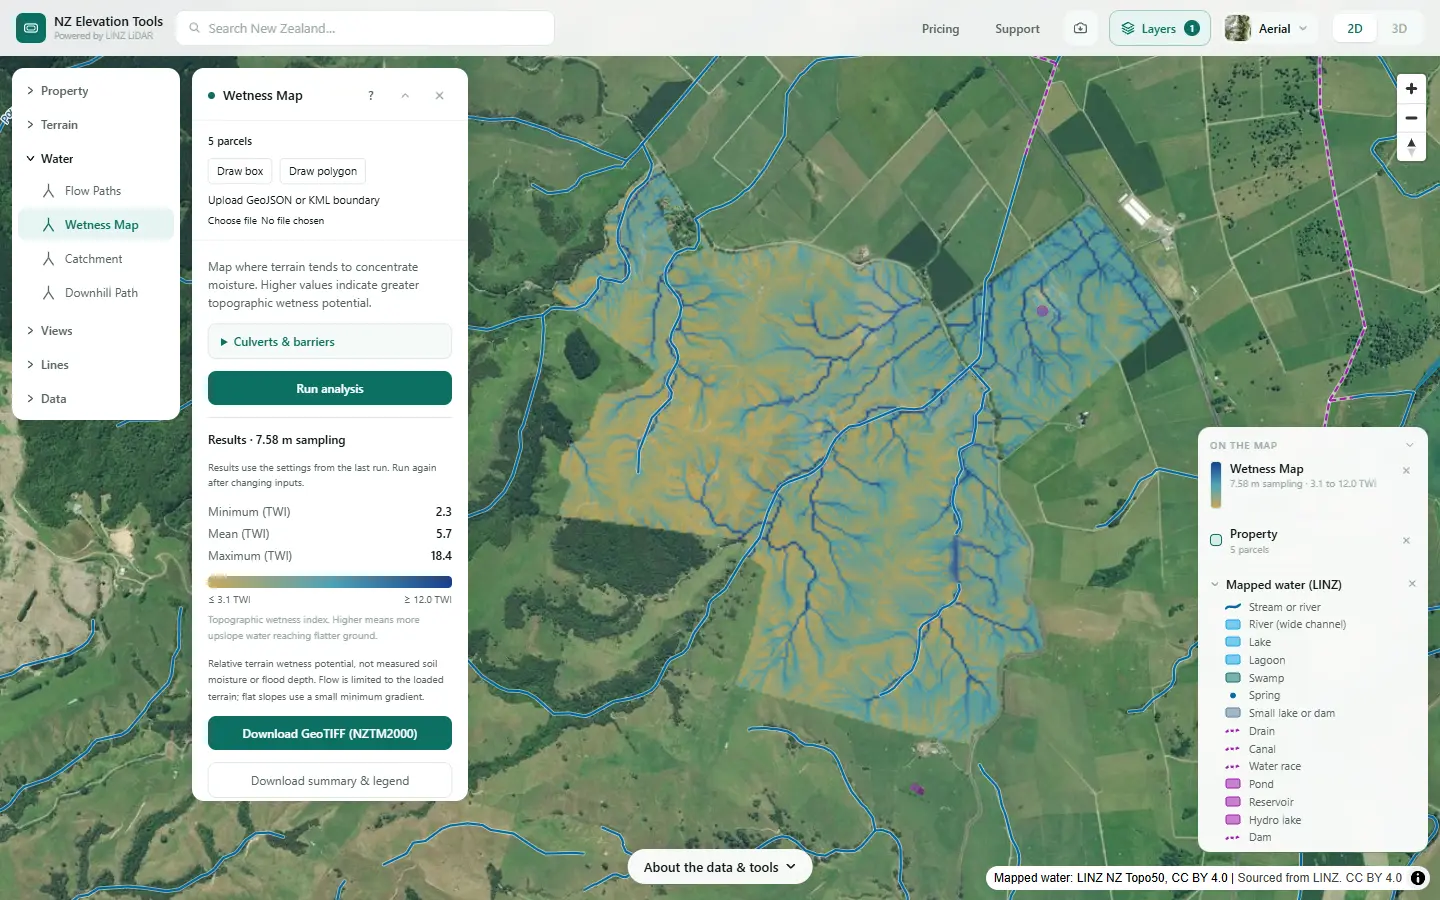
The Wetness Map ranks the farm from dry ridges to the flats where the land concentrates water. The wettest ground is often heavy soil, drained land or a wetland. Drainage, surface and sub-surface, is one of the features that sets a land unit.
Check the connection to water
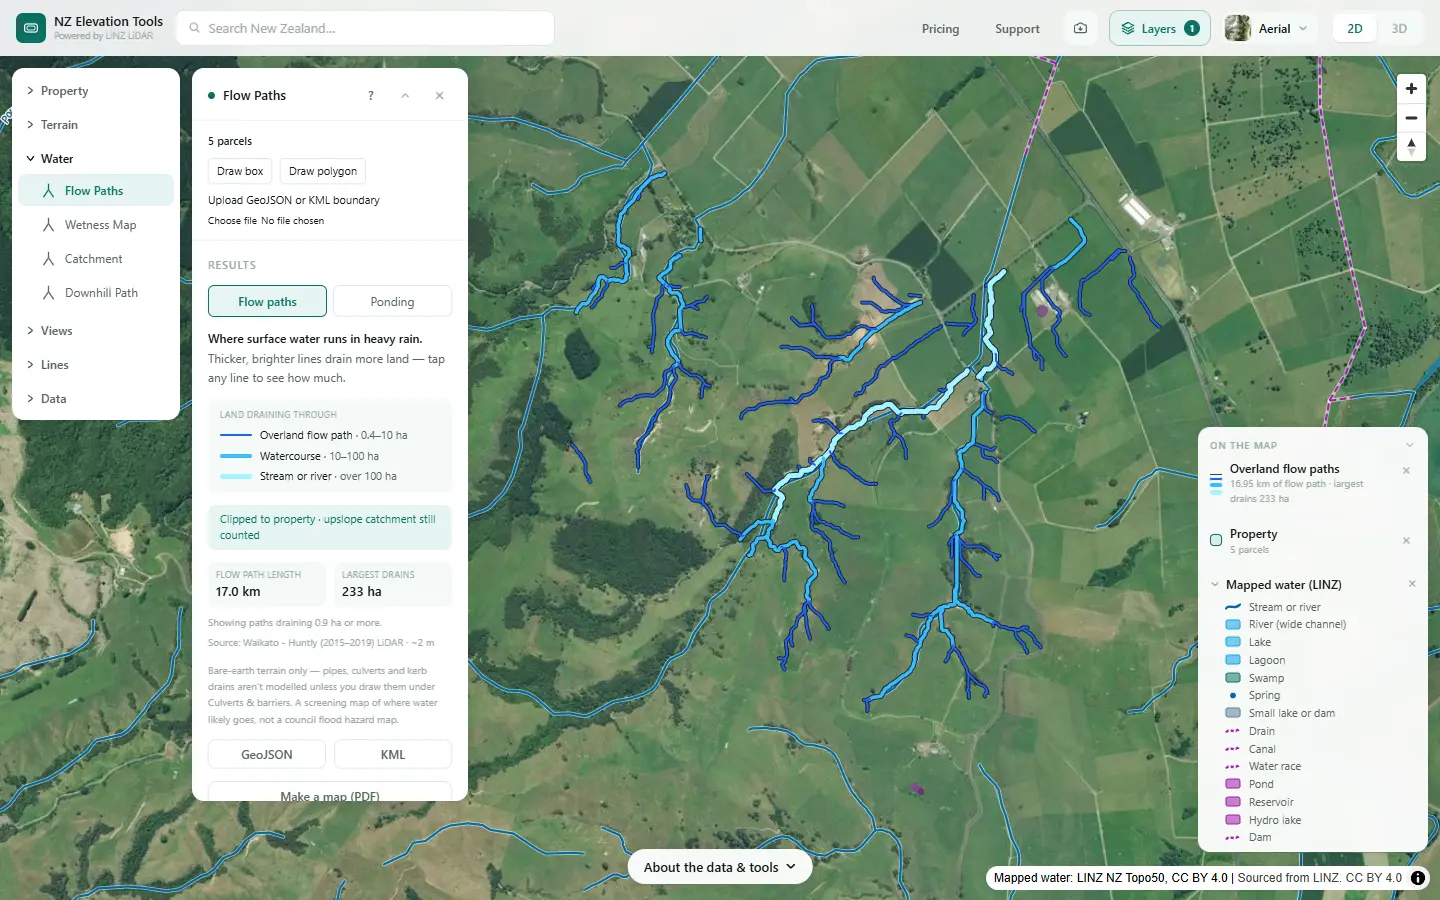
Run Flow Paths with Mapped water on. Ground whose flow paths run straight into a stream or drain is more connected to water than ground that drains onto a flat. A land unit description records that connection, and the critical source areas inside it.
Lay the soil map over it
Open S-map Online beside the slope map and compare the soil boundaries. Heavy soils and free-draining soils behave differently even on the same slope, so a flat may split into two units on soil alone. Climate and irrigation come from your own records.
Keep the slope map open →Look for history the terrain hides
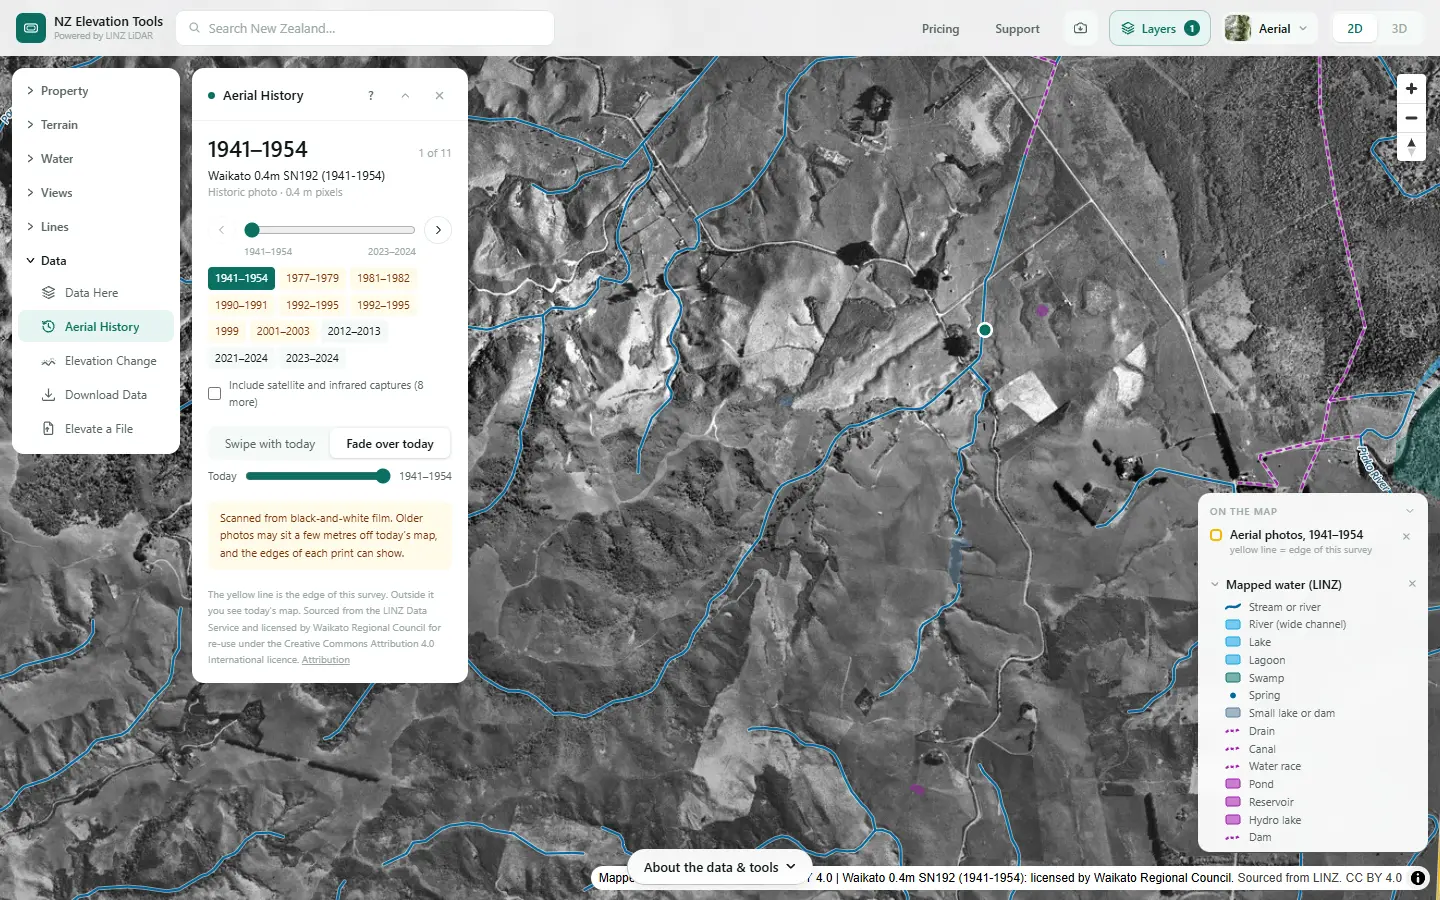
Old aerial photos show slips that have grassed over, drained swamps and filled gullies. Ground, in the Layers menu, draws the slips LINZ has mapped, and Elevation Change shows where the ground has moved between two LiDAR surveys, where there are two.
Draw the units and measure them
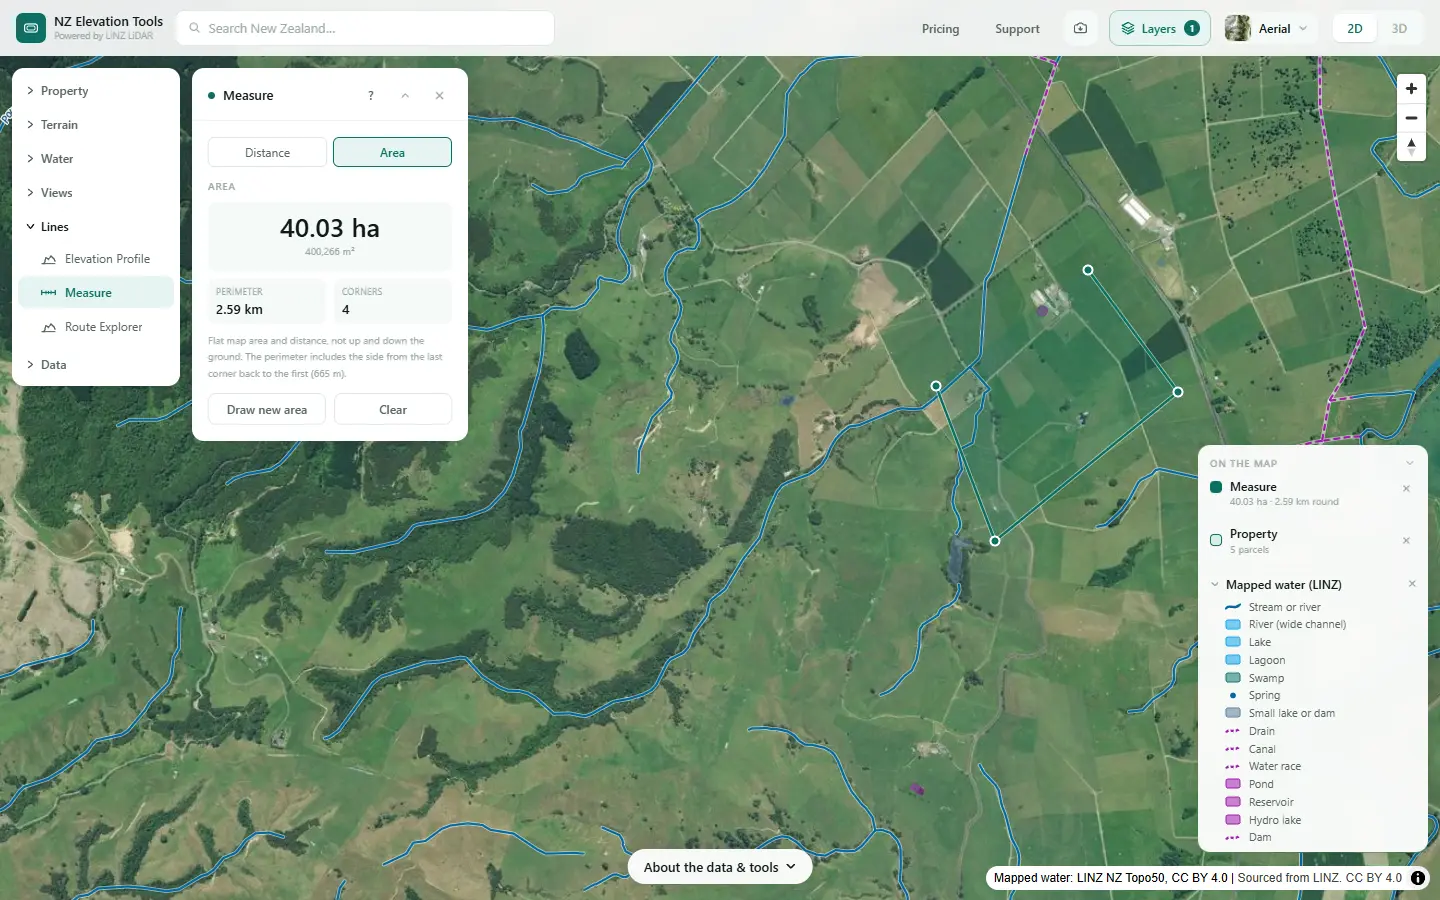
Sketch the units where the slope, landform, wetness and soil change together. Measure in Area mode gives each one in hectares. Keep the number small; join pieces that behave the same even if they are apart.
A first draft for this farm
From the maps alone, before the soil map and a walk, the farm falls into four obvious groups. These are a starting point for the farmer and adviser, not a finished set, and say nothing about how the farm is run.
| Draft unit | What the maps show | What to find out next |
|---|---|---|
| Dairy flats | About 40 ha by Measure. Under 10°, among the wetter ground on the Wetness Map, the sheds and pond, hollows that pond. | Soil drainage class, tile drains, where effluent goes, how the flats drain to the stream. |
| Rolling country | Most of the 75 ha at 10–20°. Swales running down to the gullies. | Which swales run in winter, and what is grazed or cropped across them. |
| Hill | The 39 ha at 20° and steeper: spurs, ridges and short steep faces. | Geology, past slips, what holds the steepest faces. |
| Gullies and stream margins | The valleys and hollows along the 3.9 km of mapped stream and the watercourses the LiDAR adds. | Fencing and planting already done, crossings, where stock reach water. |
The slope classes say 49% of the farm is under 10°. The flats alone are only about 18%, so most of the gentle ground is rolling country between the gullies. That is the kind of thing the maps settle quickly and a walk confirms.
Slope breaks advisers often use
The guidance does not set slope classes. Many advisers start from the Land Use Capability (LUC) slope classes in the NZ Land Use Capability Survey Handbook. Type each break into the slope panel to get the hectares above it.
| LUC class | Slope | Description |
|---|---|---|
| A | 0–3° | Flat to gently undulating |
| B | 4–7° | Undulating |
| C | 8–15° | Rolling |
| D | 16–20° | Strongly rolling |
| E | 21–25° | Moderately steep |
| F | 26–35° | Steep |
| G | Over 35° | Very steep |
LiDAR measures slope over a metre or two, so short steep banks show up that a 1:50,000 map would smooth away. On a large farm the tool reads coarser cells; run a block at a time for the fine detail.
Take the maps to your adviser
Saving each map as an image is free. With a pass, the slope and wetness grids download as GeoTIFF and the flow paths as GeoJSON or KML, for an adviser drawing the units in GIS.
What this cannot tell you
- Your soils. The terrain does not know heavy from free-draining. Use S-map Online or a soil survey.
- Geology and climate. Siltstone, pumice and greywacke behave differently on the same slope, and rainfall varies across a big farm. Neither is in the ground model.
- Where the tile drains run. Sub-surface drainage is invisible to LiDAR. The Wetness Map shows where the land would be wet without it.
- Where to draw the lines. The maps show where the land changes. You and your adviser decide which changes are worth a separate unit.
- What the rules require. Farm plan requirements are being reworked nationally and differ by region. Check with your regional council.
Related guides
- Farm maps for a freshwater farm plan — every map a plan asks for.
- Critical source areas — the gullies and hollows inside each unit.
- Natural or artificial? — mapping the streams apart from the drains.
- What catchment am I in? — the catchment context a plan asks about.
- Slope maps — how the slope figures are measured.
Screenshots from NZ Elevation Tools of a dairy and drystock farm on the edge of the Piako flats in the Waikato, with legal descriptions and owners blurred. Aerial photos and LiDAR from LINZ. Sourced from the LINZ Data Service and licensed by Regional Software Holdings Limited and Waikato Regional Council for re-use under the Creative Commons Attribution 4.0 International licence.
Frequently asked questions
What is a land unit in a farm plan?
An area of the farm with similar physical features: soil, slope and landform, climate, irrigation and drainage. It does not have to be in one piece; all the steep faces on a farm can be one land unit. The guidance asks you to keep the number of land units to a minimum, map them, and describe each one.
How many land units should a farm have?
As few as describe the real differences. Many farms end up with three to six: the flats, the rolling country, the hill and the steep faces, perhaps a wet area or an irrigated block. There is no set number; split where the risks to water change, not where the fences run.
Are land units the same as paddocks or LUC classes?
Not necessarily. Paddocks follow fences, and land units follow the land, so one unit can cover many paddocks and one paddock can sit across two units. Land Use Capability (LUC) mapping is a related, older system; its slope classes are a useful starting point, but a farm plan does not require them.
Where do I get a soil map for my farm?
S-map Online, from Manaaki Whenua – Landcare Research, maps soils for much of New Zealand’s farmland and is free to view. It gives the soil type, drainage class and other properties. Where S-map has no coverage, your regional council or adviser may have older soil maps.
Can I draw and save the land units on this site?
Not yet. You can measure each unit’s area with Measure, and save images of the slope, landform and wetness maps, which is often enough for an adviser to draw the units from. The slope and wetness grids download as GeoTIFF with a pass, for anyone drawing the units in GIS.
What are inherent vulnerabilities?
The risks to water that come from the land itself, before anything is farmed on it: steep siltstone hill that slips, heavy soil that runs off, free-draining soil over shallow groundwater that leaches. A land unit description is where you record them.