Farm Maps for a Freshwater Farm Plan
Freshwater farm planning starts with understanding your land and how water moves across it. These are the terrain maps that understanding is built on, made for your own farm from public LiDAR.
Whatever it is called where you farm, a freshwater farm plan, a farm environment plan or an industry programme’s plan, it starts in the same place: a map of the farm that shows the land, the water and where the two meet. The actions come later. First you need to see which faces are steep, where runoff gathers, which gullies reach the creek and how much land feeds each one.
That part of farm mapping no longer needs a consultant with GIS software. Toitū Te Whenua LINZ publishes a ground model built from airborne LiDAR surveys, and the tools on this site turn it into farm maps in a browser, on a phone in the paddock if you like.
Where the rules stand
Written November 2026. The national freshwater farm plan system is being reworked. The Government announced changes in August 2026, and the national rollout is paused while new regulations are written. Several regional councils and industry bodies run their own farm plan requirements in the meantime. Who needs a plan, by when and what it must contain are questions for your regional council or your adviser, and this guide does not answer them.
The mapping is worth doing either way. Knowing where water runs on your farm pays for itself in where you put a crop, a crossing, a trough or a fence.
The terrain maps, and the tool that makes each
| Map | Tool | What it shows |
|---|---|---|
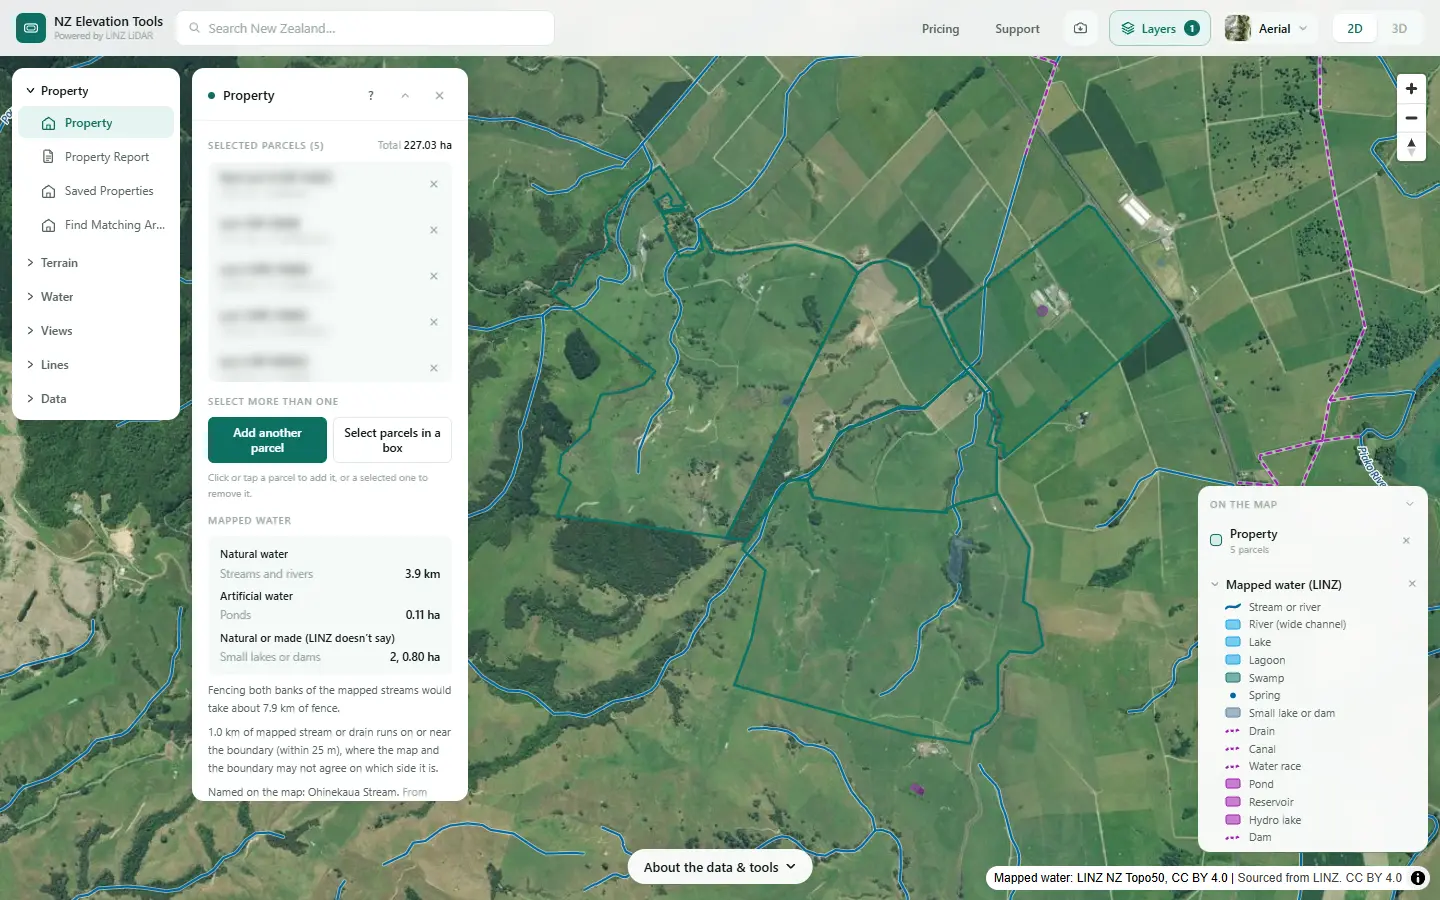
| Farm boundary | Property | The legal titles, up to 25 selected together, from the LINZ cadastre. The working area for every other map. |
| Slope | Slope & Aspect | Slope in degrees across every paddock, the share of the farm in each slope class, and which way each face points. |
| How water moves | Flow Paths | The gullies and swales runoff follows, each labelled with the hectares draining through it. The starting point for critical source areas. |
| Where water sits | Flow Paths, Ponding view | The hollows that fill before they spill, with depth, area and volume. |
| Wet ground | Wetness Map | A ranking from dry ridges to the flats and seeps where the shape of the land concentrates water. |
| Land draining to a point | Catchment | All the land upstream of a culvert, crossing, sediment trap or wetland, in hectares. |
| Contours | Contour Lines | Height lines across the farm, as a base for any other map. |
Every map a plan asks for
The guidance lists the features a plan’s maps must show, where they apply (MfE, Developing a freshwater farm plan, section 2). You choose how many maps and what goes on each. Here is the full list, with what on this site helps and what comes from elsewhere. Each guide walks through the same real Waikato farm.
Features related to inherent vulnerabilities
| Farm boundaries, and any leased or licensed land | Property |
| Areas of distinctly different land use | Aerial photo and Vegetation layer |
| Land units | Land units guide |
| Surface freshwater bodies | Mapped water · Natural or artificial? |
| Artificial freshwater bodies | Mapped water · Natural or artificial? |
| Soils | From S-map Online (Manaaki Whenua) |
| Landform, including slope | Slope & Aspect · Landforms |
| Potential winter grazing areas, and critical source areas in them | Winter grazing guide |
| Other critical source areas | Critical source areas guide |
| Drainage systems and areas | Drainage guide |
| Irrigation and frost protection | From your own records |
Features related to farming activities
| Fencing to exclude stock from water | Riparian fencing guide |
| Planted riparian areas | Riparian fencing guide · Measure |
| Soil erosion control plantings or works | Erosion and slips guide |
| Effluent systems and application areas | From your own records; Downhill Path shows where runoff goes |
| Water-take bores, intakes and fish screens | From your own records and council consents |
| Freshwater crossings: bridges, culverts, fords, unformed | Crossings and tracks guide |
| Stock-holding areas: feed pads, winter and stand-off pads | Aerial photo; the Ponding view shows where water sits |
| Sheds, barns, shelters and yards | Buildings and Farm features layers |
| Farm accessways: roads, tracks, races, underpasses | Roads and tracks layer · Crossings and tracks guide |
| Point sources: dumps, offal and silage pits, storage, washdown | From your own records; Downhill Path shows where runoff goes |
| Private drinking water supply points | From your own records |
Catchment context
| Catchment context from the regional council | What catchment am I in? · Traditional names |
Action plan
| New physical works in the action plan | Measure, Catchment, and the culvert and wetland guides |
Start with the farm boundary
Search the address, click the title and Shift-click the rest. Then switch to Flow Paths or Slope. Free to use, no login.
Open the map →What the maps leave to you
A farm plan needs more than terrain, and none of the following comes from LiDAR:
- Soil and land types. Soil maps and land use capability come from soil surveys and from knowing the ground.
- What happens on the land. Paddocks, fences, stock classes, crops, effluent areas, races and yards.
- Nutrient budgets. Those come from your records and a model such as Overseer.
- Drains. Tile drains, culverts and pipes are not in the terrain, so the flow maps route water over the surface.
- The risk itself. The maps show where water runs, gathers and sits. They do not model sediment or nutrient loss. Whether a gully is a critical source area depends on what the water passes through on its way.
Handing the maps to an adviser
There are three ways to pass a map on, and the first is free.
- A map image. Save image exports what is on screen as a picture, with the data credit on it, to drop into a document or an email.
- The site itself. Your adviser can run the same tools on the same farm. There is no login to set up.
- The data files. With a pass, flow paths, catchment outlines and the boundary download as GeoJSON or KML for QGIS, ArcGIS or Google Earth, and slope and wetness as GeoTIFF grids. An adviser can lay them over soil maps, paddock boundaries and their own planning layers.
Start with the water
The farm workflow runs the tools in the order you would use them, from the boundary to the land above each gully.
Related guides
- Critical source areas: map them on your farm — where runoff gathers, and how to check it.
- How to divide your farm into land units — slope, landform, wet ground and soils.
- Natural or artificial? — the streams on a farm apart from the drains and ponds.
- What catchment am I in? — the catchment context a plan asks about.
- LiDAR coverage in New Zealand — whether your farm has been flown, and when.
- Terrain checks before buying rural land — the same maps, before you buy.
Frequently asked questions
What maps does a freshwater farm plan need?
A farm plan is built on a map of the farm: the boundary, the waterways, the different kinds of land, the steep and erosion-prone ground, and the places where runoff can carry sediment and nutrients to water. What a plan must show is set by the rules your regional council applies, and the national rules were being redrafted in November 2026, so check the current requirement with your council or adviser.
Do I need a freshwater farm plan?
It depends on your region, your land use and the size of the farm, and the answer has been changing. The Government announced changes to the national system in August 2026 and paused the rollout while new regulations are written. Your regional council, your industry body or your farm adviser can tell you where you stand today.
Can I make the maps myself?
The terrain ones, yes. Slope, flow paths, wet ground and catchment areas come straight from public LiDAR, and you can run them for your own farm in a browser. Soil, land use, fences, stock classes and nutrient budgets come from you, your records and tools such as Overseer.
Is the mapping free?
Running every tool and viewing the result is free, with no account, and so is saving the map as an image. Downloading the data files behind a map, for a GIS or Google Earth, needs a pass.
Can my farm adviser open the files?
Yes. Flow paths, catchment outlines and the farm boundary export as GeoJSON or KML, which open in QGIS, ArcGIS and Google Earth. Slope and wetness export as GeoTIFF grids in NZTM2000, the projection New Zealand GIS work uses.
How accurate are the maps?
As good as the LiDAR survey over your farm and its date. On open pasture the ground model follows the real surface closely. It is weaker under dense bush, and it does not show anything built or dug since the survey was flown. Where no LiDAR has been flown, a coarser 8 m national model is used, which is fine for the shape of a hill block and too coarse for small swales.