Mapping Farm Drainage: Drains, Wet Ground and Ponding
Drains are the fastest route from a paddock to a stream, and most of them are not on any map. Here is how to map the drainage on a farm from LiDAR, and what you have to add yourself.
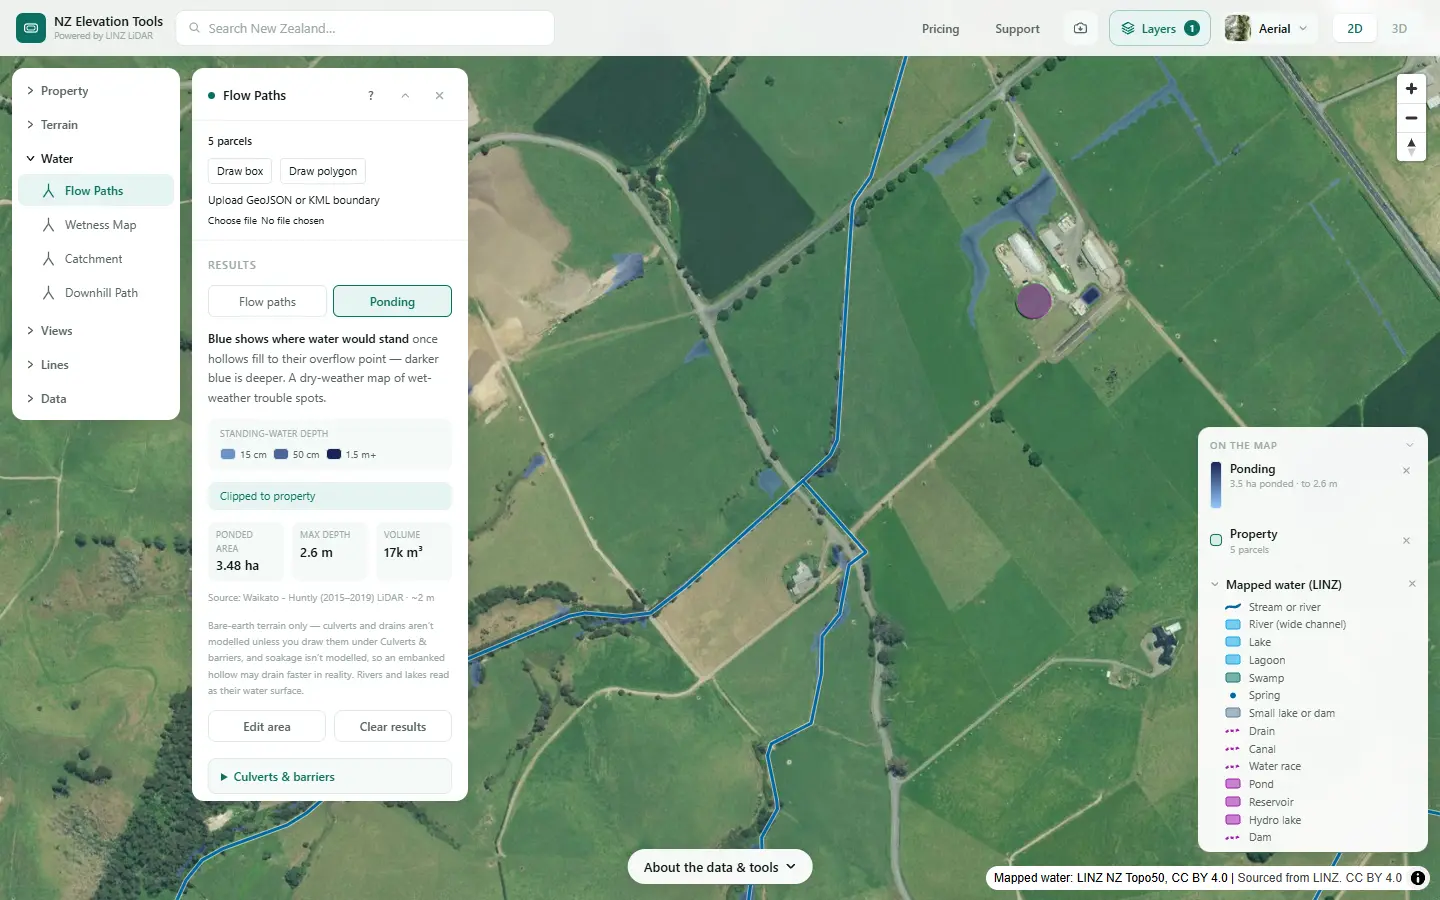
A freshwater farm plan maps the farm’s drainage systems and areas (MfE, Developing a freshwater farm plan, section 2.1), and land drainage, surface and sub-surface, is one of the features that decides land units. Drains matter because they short-cut the soil: nitrate, bacteria and fine sediment reach the stream in hours instead of seeping through the ground.
See where the land stays wet
Select the farm and run the Wetness Map, then Flow Paths with Ponding. Free to use, no login.
Open the Wetness Map →Map it in six steps
Shown on a dairy and drystock farm on the edge of the Piako flats in the Waikato, with the numbers the tools gave on 19 November 2026.
Switch on the mapped drains
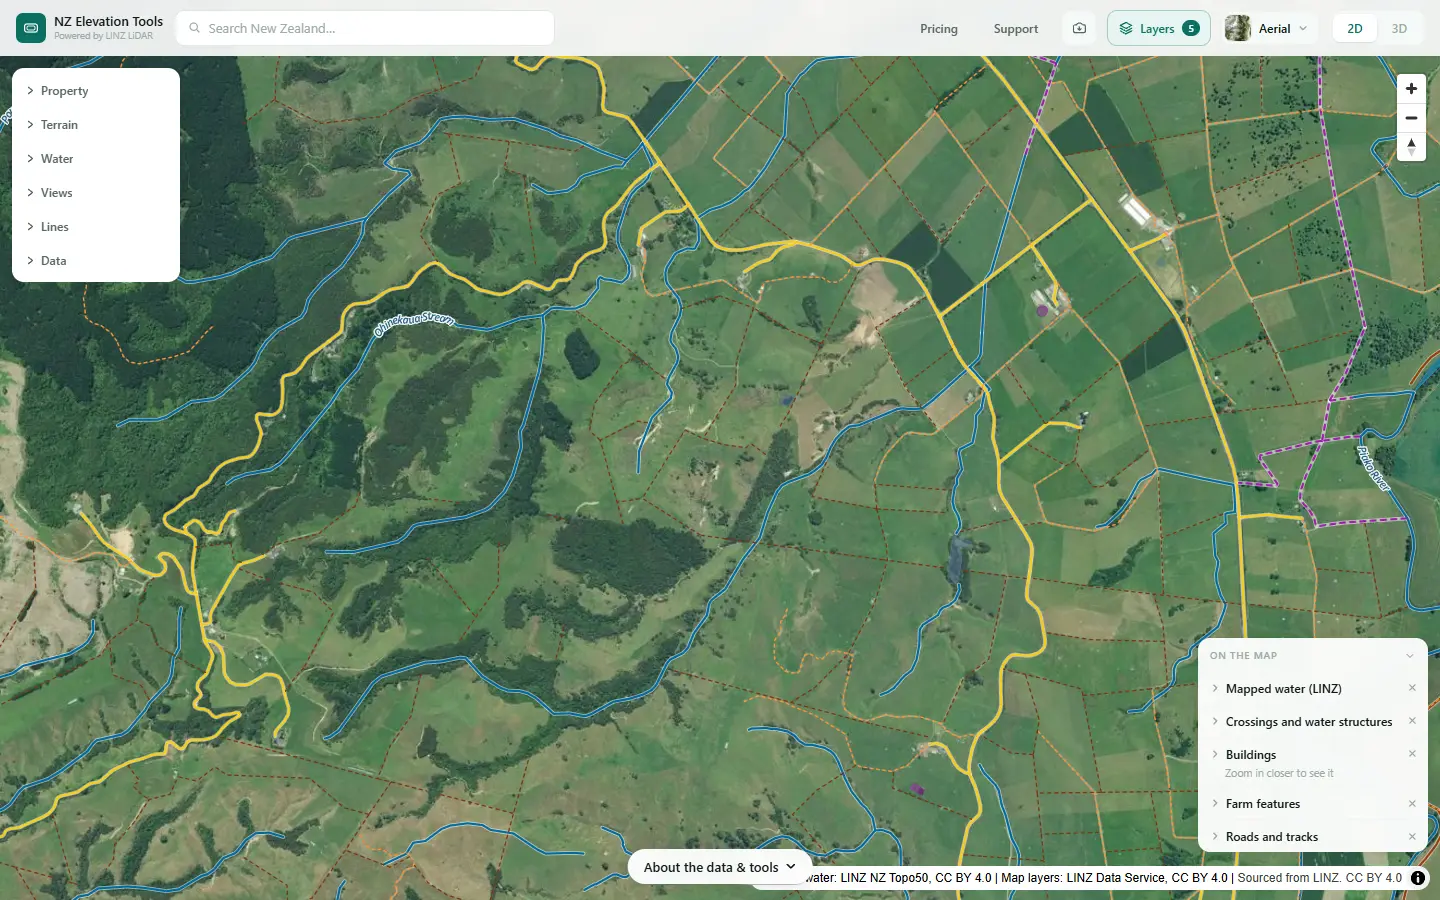
Select the farm with Mapped water on. Drains, canals and water races are the purple dashed lines. The Property panel lists the length of each kind inside the boundary. On many farms the list is short, because the 1:50,000 map leaves most farm drains off.
Find the wet ground
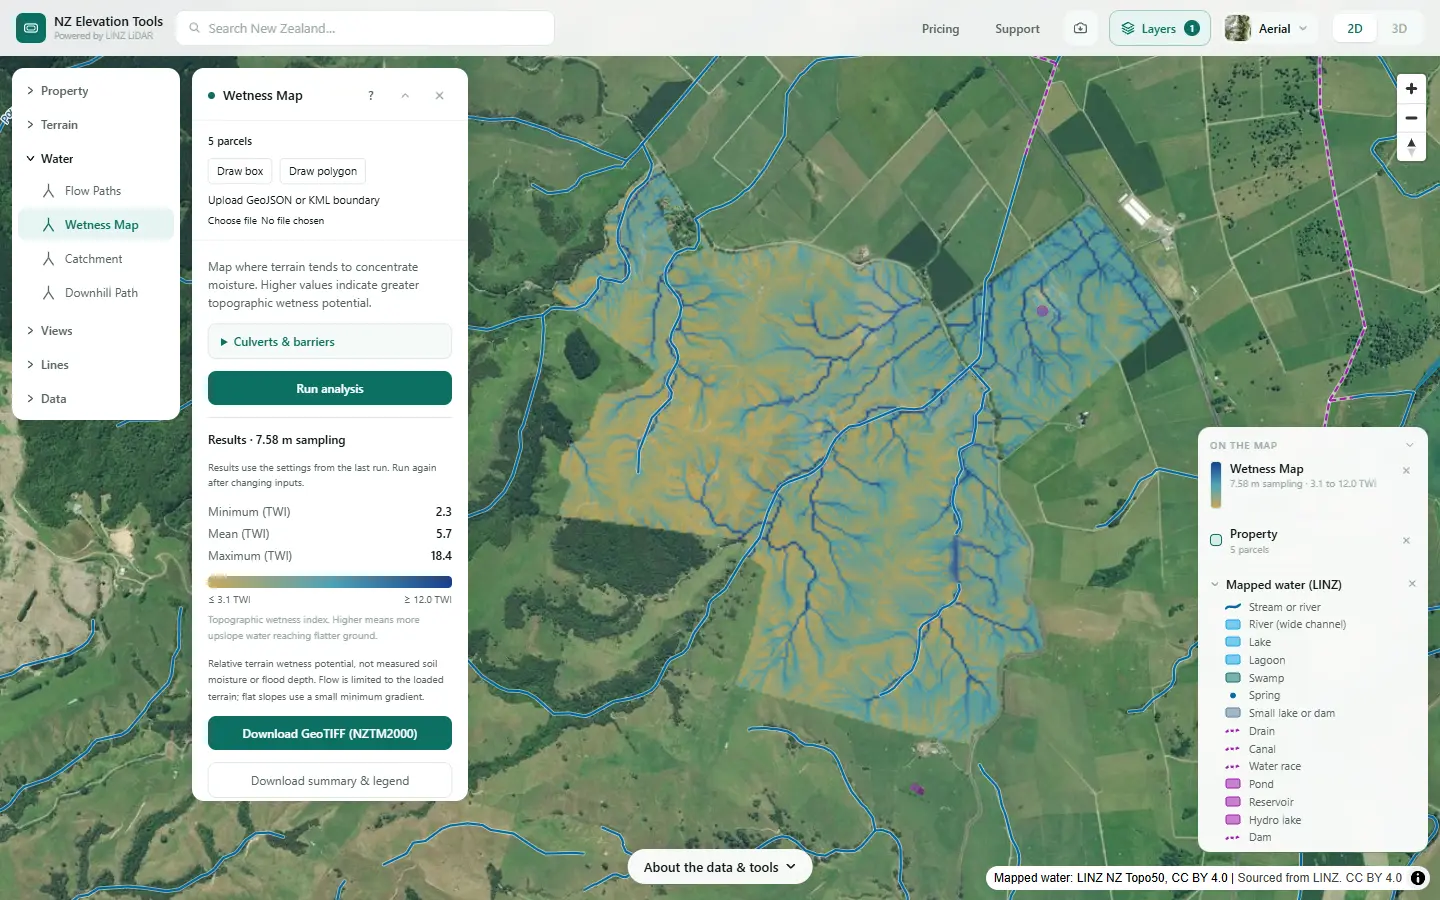
Run the Wetness Map. It ranks the land by how much the shape of the ground concentrates water. The darkest blue is where land stays wettest: the flats and gully floors where drains were usually laid, and where seeps come out.
See what still ponds
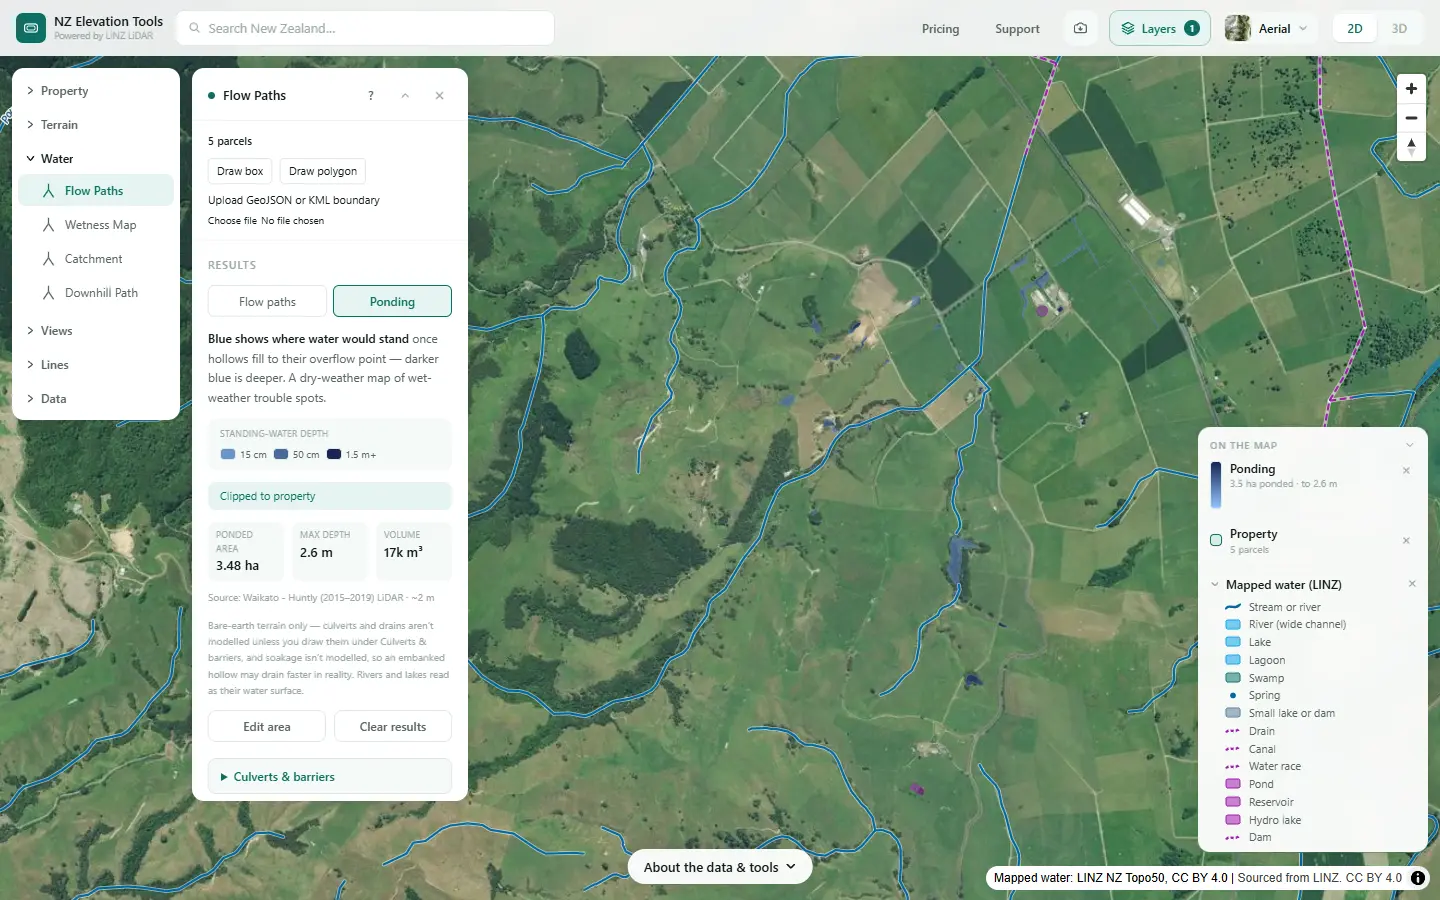
Run Flow Paths and switch to Ponding. Blue is where water would stand once the hollows fill, with its depth and volume. On drained flats, the hollows that still pond are where the drainage is not reaching, or where a culvert or drain the terrain cannot see does the work.
Pick out the open drains in the LiDAR
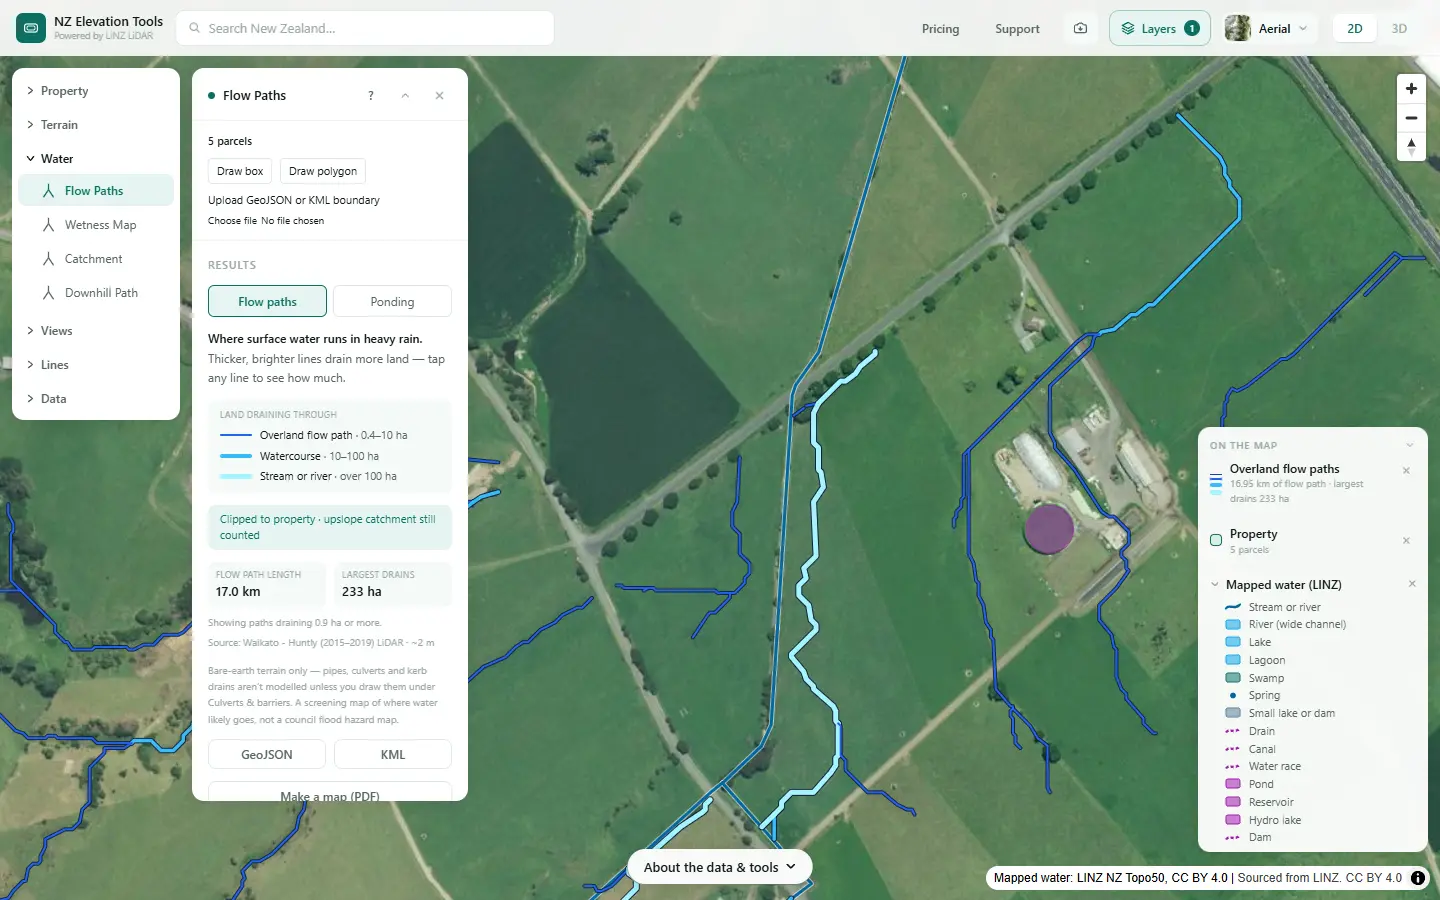
Zoom in on Flow Paths over the flats. An open drain deep enough to register shows as a straight flow path along a fence or a paddock edge; a natural stream winds. Compare with the mapped water: the LiDAR line is usually the better guide to where the channel really runs.
Look for old drains and swamps
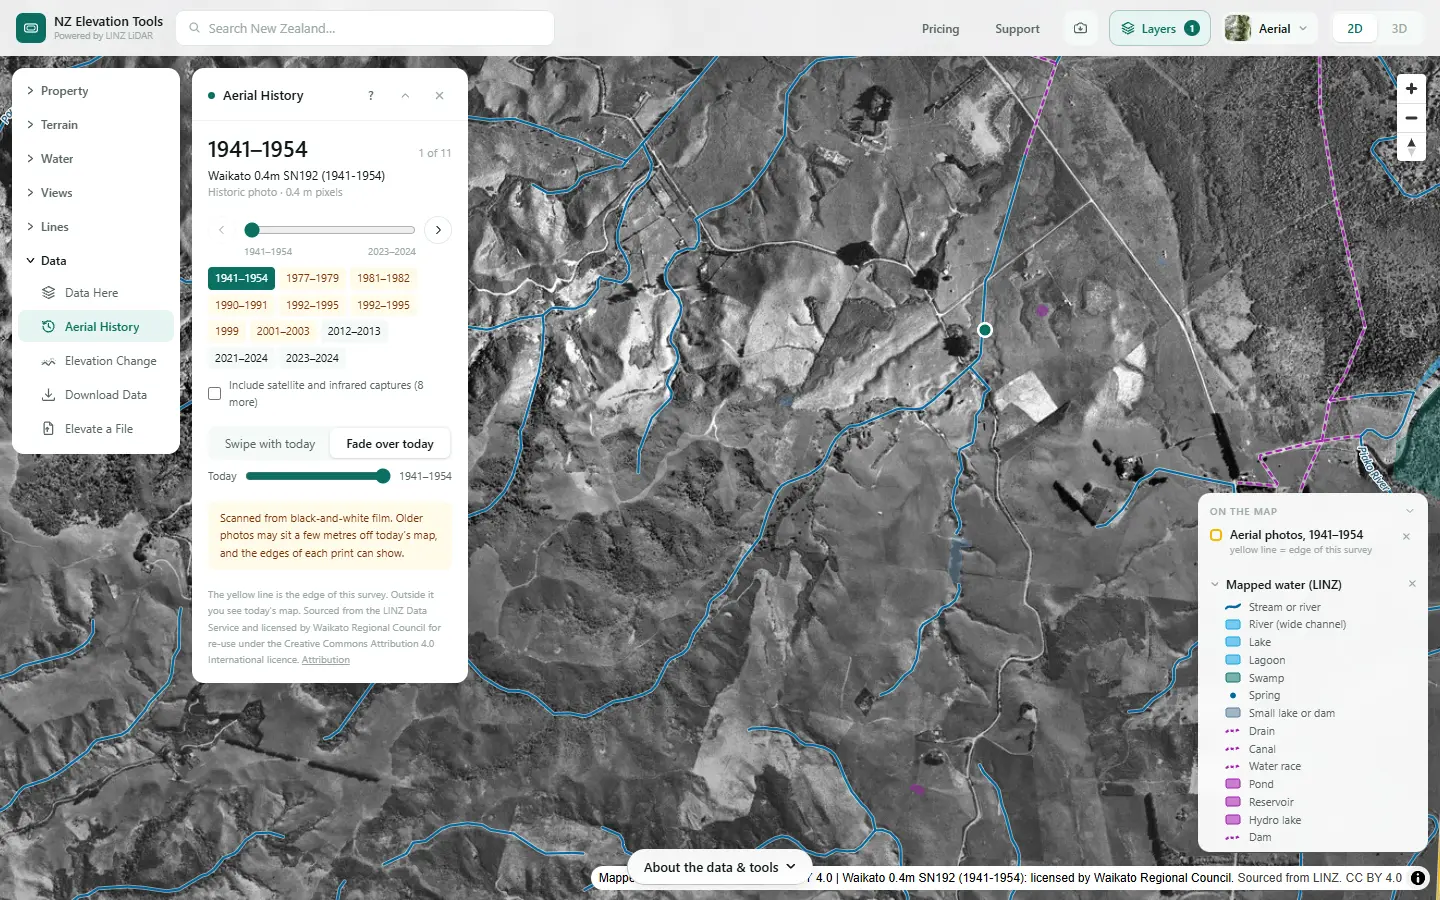
Step back through the photos. Swamp that has since been drained, old drain lines and the year new ones appeared all show. On peat and drained swamp the ground has often sunk since, which the Wetness Map and ponding view reflect.
Draw what the terrain misses
Open Culverts & barriers in Flow Paths and draw the culverts under tracks and roads, the drains the LiDAR misses, and any barriers. Run again and the flow paths and ponding follow them. Mark tile drain outlets on a printout or in your adviser’s software; they are part of the drainage map too.
Flow Paths, Culverts & barriers →Give it to your adviser
Saving the maps as images is free. With a pass, the wetness grid exports as GeoTIFF, flow paths as GeoJSON or KML, and the mapped drains in the property data ZIP.
What this cannot tell you
- Where the tile and mole drains are. They are underground. Farm records, the person who laid them, and wet lines in the paddock after rain are the sources.
- Whether a drain is legally a stream. A drain dug in a natural watercourse may count as a river. See Natural or artificial?
- How well the drains work. The ground model is a snapshot of the surface; it does not know if a drain is blocked.
- The rules on drain maintenance. Councils set them, and they differ. Ask before cleaning a drain.
Related guides
- Natural or artificial? Streams, drains and ponds on a farm map
- How to divide your farm into land units
- Where is the nitrate in my stream coming from?
- Catchment area for a culvert or crossing
Screenshots from NZ Elevation Tools of a dairy and drystock farm on the edge of the Piako flats in the Waikato, with legal descriptions and owners blurred. Aerial photos and LiDAR from LINZ. Sourced from the LINZ Data Service and licensed by Regional Software Holdings Limited and Waikato Regional Council for re-use under the Creative Commons Attribution 4.0 International licence.
Frequently asked questions
What does a farm plan mean by drainage systems and areas?
The drains that move water off the farm, open and sub-surface, and the areas they drain. Drains matter because they are a fast route from the soil to the stream for nitrate, bacteria and sediment, and drained land is often a land unit of its own.
Can LiDAR show my tile drains?
No. Tile and mole drains are underground, and LiDAR measures the ground surface. It does show open drains deep enough to register, the wet flats and hollows where drains were usually laid, and the low spots that still pond, which often point to where sub-surface drainage is or would help.
Why are my drains not on the map?
The LINZ topographic map was drawn at 1:50,000, so it shows the main drains and canals but leaves off most farm drains. Flow Paths often picks up an open drain from the LiDAR anyway, as a straight flow path along a fence line.
How do I make the water tools follow my drains and culverts?
Open Culverts & barriers in Flow Paths, Catchment or the Wetness Map and draw them: a culvert where water passes under a road or track, a drain line, or a barrier water cannot cross. The tools then route water through them instead of over the surface.