Water · Click a point
Where does rain from your land go? Trace it downhill
Where does water flow from your land? Click any spot in NZ and this tool follows rain down the ground from there, one LiDAR cell at a time, and draws the line it takes to the nearest stream, river or the sea.
Flow Paths shows every water path across an area, and Catchment shows the land draining to one point. This answers the other question: starting here, where does the water end up?
Free to run · pay to download
See the full result on the map free, with no account. Download the path as GeoJSON with a pass: NZ$49 for 7 days or NZ$299 for 12 months, one-off, GST included, not a subscription. Every download on the site is included while the pass lasts.
Who uses this
- Owners and buyers. See where runoff from a house site or driveway goes, and whether it crosses a boundary.
- Septic and earthworks designers. Check the line and the distance from a disposal field or a cut to the nearest watercourse.
- Farmers. See where runoff from a yard or an effluent area ends up, and how far it is to a stream.
When to use it
- Checking where runoff from a house site, driveway or new hardstand would go.
- Seeing which way a spill, or water from a septic field, would travel, and how far it is to a stream.
- Working out whether water from your land crosses a neighbour's boundary, a road or a building platform.
Which tool for your job
Downhill Path is one step in a bigger question. These are the jobs it helps with, and the tools that go with it.
If you’re working on drainage, flooding and wet ground
Where does the water go, and where will it sit?
- 1.Flow Paths — The overland flow paths across an area, sized by the land draining through them, and where water ponds once hollows fill.
- 2.Wetness Map — Which parts of a paddock the shape of the land keeps wet.
- 3.Catchment — All the land that drains to one culvert, gully or low corner.
- 4.Downhill Path (this tool) — Where rain from one spot ends up: the line it runs, and the stream it reaches.
- 5.Landforms — Hollows, valleys and footslopes at a glance: where water gathers.
How to use it
- Open Downhill Path and click the spot. There is nothing to set, and the path starts straight away from exactly where you clicked.
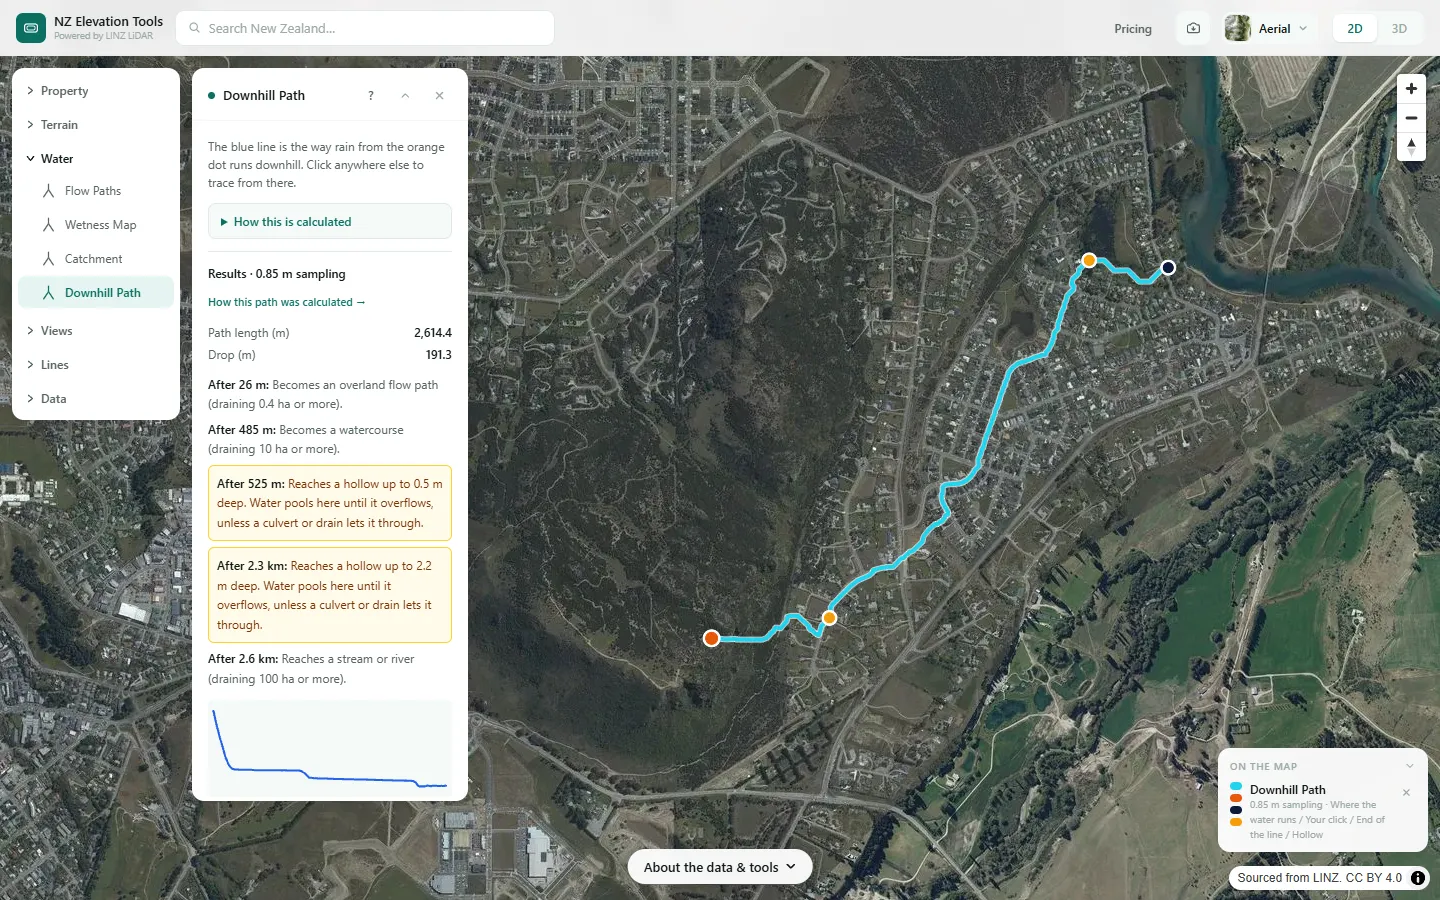
- The blue line shows where the water runs, from the orange dot to the dark dot at the end.
- Read the list in the panel: how far until the water joins a water path, becomes a watercourse or reaches a stream, and any hollows it passes through. Click anywhere else to trace from there.
- To compare with the streams, drains and ponds LINZ has mapped, switch on Mapped water in the Layers menu at the top of the map (on a phone, in the Map menu).
Step by step: Mt Iron, Wānaka
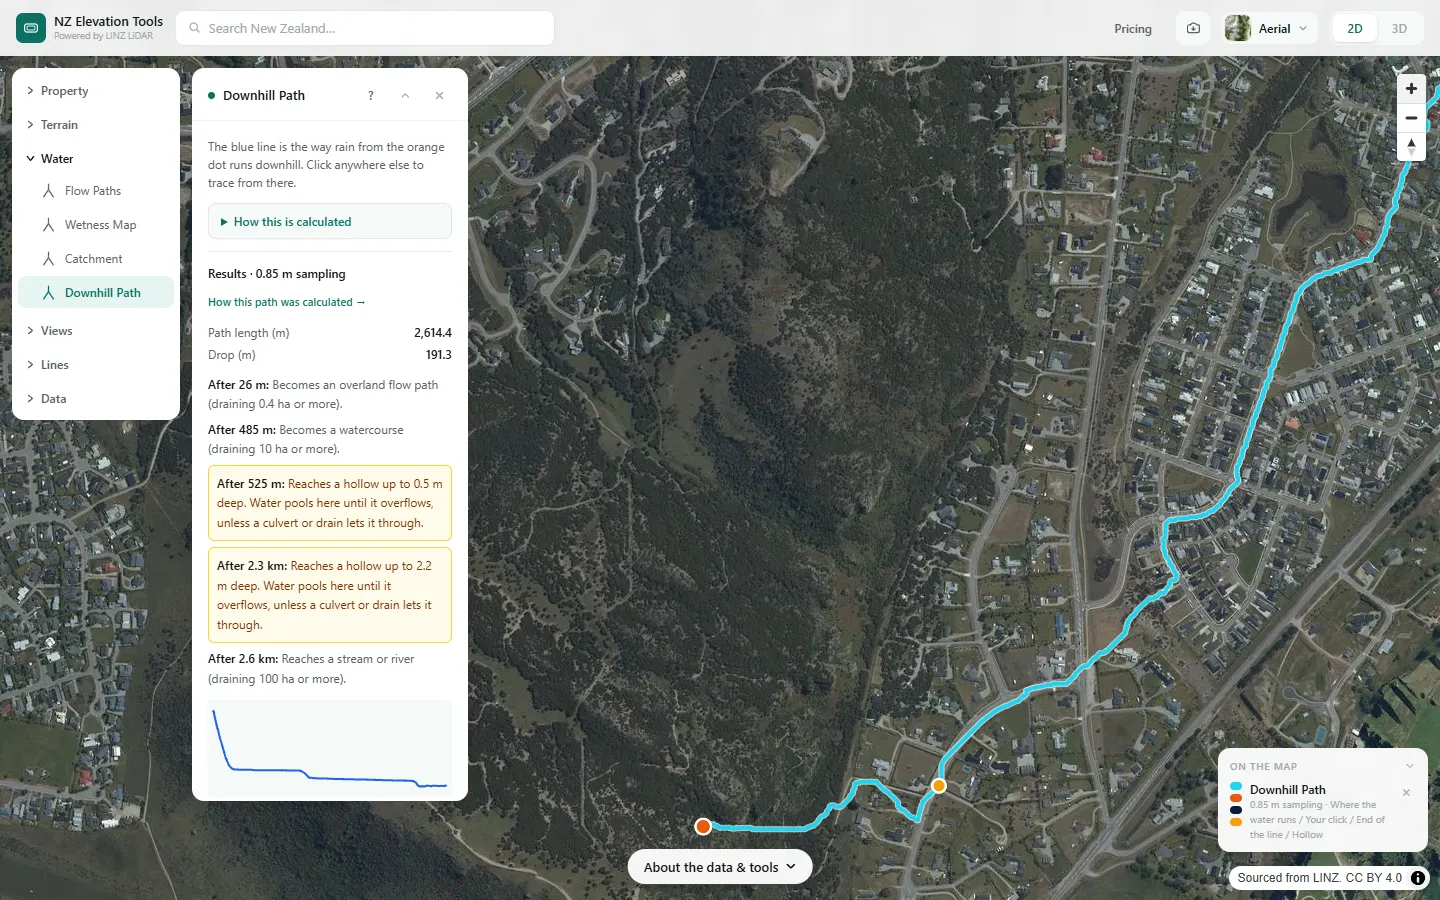
We follow rain from a spot on the southern slope of Mt Iron down through the subdivision below it.
What it showed
- The line is the steepest route from one exact point. Click a few metres away on a broad slope and it can take a different line, so try more than one spot if the answer matters.
Screenshots from NZ Elevation Tools. Aerial imagery from LINZ Basemaps. Sourced from the LINZ Data Service and licensed by Environment Southland, Otago Regional Council and Queenstown-Lakes District Council for re-use under the Creative Commons Attribution 4.0 International licence.
How it works
This is the Catchment calculation pointed the other way. Catchment starts at a point and walks uphill to find all the land draining to it. Downhill Path starts at a point and walks downhill to find the one line water takes away from it.
LiDAR bare-earth terrain is loaded around your click, in cells about 0.9 m across. Small pits are filled so water can always keep moving, and each cell sends its water to its steepest downhill neighbour. From your click, the tool follows those steps one cell at a time.
When the water gets within 200 m of the edge of the loaded terrain, the tool loads more around where the water has got to and carries on. So unlike Catchment, the path never gets coarser as it gets longer. It stops at a stream or river draining over 100 ha, at the sea or ground with no elevation data, or after about 5 km or more if neither comes first.
Method, sources and who built it
- Terrain: the LINZ elevation tiles of the national bare-earth elevation model (LiDAR where it has been flown), loaded in your browser in windows 1.6 km across, each centred on where the water has got to, and read at about 0.9 m per cell.
- Depression filling with the Priority-Flood algorithm (Barnes, Lehman and Mulla, 2014), then D8 steepest-descent routing (O’Callaghan and Mark, 1984).
- The path is the chain of D8 steps from the clicked cell. Each window hands over 200 m short of its edge, because routing near an edge is distorted when hollows drain out of it.
Not modelled
- Pipes, culverts, drains and stopbanks.
- Soakage, rainfall amounts and flow depth or speed.
- Water spreading across a slope: the tool draws one line, the single steepest route.
References
- Toitū Te Whenua LINZ, New Zealand LiDAR 1 m DEM, via the LINZ Data Service (CC BY 4.0; each survey licensed by the council or agency that commissioned it).
- Barnes, R., Lehman, C. and Mulla, D. (2014). Priority-flood: an optimal depression-filling and watershed-labeling algorithm for digital elevation models. Computers & Geosciences, 62, 117–127.
- O’Callaghan, J. F. and Mark, D. M. (1984). The extraction of drainage networks from digital elevation data. Computer Vision, Graphics, and Image Processing, 28(3), 323–344.
Built and maintained by MapScaping. The processing chain is published here in full so you can judge whether the result fits your purpose. It is a screening reference, not engineering advice: for consent, design or a purchase decision that turns on flooding, get the council’s hazard information and a site-specific assessment from a chartered professional engineer. Method last checked against the code 2026-11-01.
Reading the results
Path length is measured along the line, and drop is the height difference between your click and the end of the line.
The stages use the same classes as Flow Paths: a water path drains at least 0.1 ha, an overland flow path 0.4 ha, a watercourse 10 ha, and a stream or river 100 ha. Each is the distance at which the water first reaches that size, and the areas only count land inside the terrain loaded so far, so a stage can really begin earlier.
A hollow is a low spot on the path at least 0.5 m deep. Water pools there until it overflows, unless a culvert or drain lets it through. A hollow against a road or embankment usually means there is a culvert the tool cannot see.
The elevation chart should fall from left to right. Flat stretches are hollows that have been filled, or water surfaces. A "Check this one" warning means the whole path has almost no fall, so it is probably on a lake, a river or very flat ground and the line can't be relied on.
Limits and warnings
- Culverts, pipes and drains are not in the terrain, so water is routed over roads and through embankments. This is the most likely reason a path looks wrong near a road. Culverts and barriers you draw in Flow Paths, Wetness or Catchment are not used by Downhill Path yet.
- It shows where water runs once it is running. Rain soaking into the ground, and how much rain it takes to get runoff started, are not modelled.
- The line is one path, but water spreads. On flat ground or a broad slope, a few centimetres decide the way it goes, and a click a few metres away can take a different line.
- Flat water and braided riverbeds have no clear downhill path, so the line there can wander. It does not name the stream or catchment, and it stops being useful once the water is in a river.
Data and attribution
Heights come from the LINZ elevation tiles: LINZ’s national bare-earth elevation model (LiDAR where it has been flown, the 8 m model elsewhere), stored in 0.1 m steps, read in your browser in squares 1.6 km across, each loaded around where the water has got to, in cells of about 0.9 m the whole way. Over the sea the tiles read 0 m; they hold no seabed.
Elevation and cadastral data is sourced from the LINZ Data Service and licensed for re-use under the Creative Commons Attribution 4.0 International licence. Copyright in each LiDAR survey belongs to the body that commissioned it — a regional or district council, Waka Kotahi, NIWA and around thirty others — rather than to LINZ, which hosts and processes the national dataset. Every file exported from this site names the licensors whose surveys cover the area, and anything you publish from those files carries the same attribution requirement. See https://www.linz.govt.nz/products-services/data/licensing-and-using-data/attributing-elevation-or-aerial-imagery-data
Questions
Why does the line go straight over a road?
Culverts and pipes aren't in the terrain, so the tool can't see them. A hollow against a road or embankment usually means there is a culvert there, and the water really passes through it.
Does it tell me how much water, or how fast?
No. It shows the route water takes, not how much of it there is or how quickly it moves. Rainfall, soakage and flow rates need a site assessment from an engineer.
Does it name the stream or catchment?
Not yet. It shows the line to the stream and how much land that stream drains at that point, but it does not have the name.
Ready to try it?
Open Downhill Path on the map →Free to use, no account. Runs in your browser on LINZ open data. Downloading the results needs a pass: see prices.
Missing something you need? Suggest a feature or ask about custom work.