Before and After in LiDAR: Cyclone Gabrielle and the Kaikōura Earthquake
Where the ground dropped and where it rose, measured by subtracting one LINZ LiDAR survey from another, with the aerial photos side by side. Each example opens on the map with one click.
LINZ has flown parts of New Zealand with LiDAR more than once, and every survey is published on the same 1 m grid. Subtract the older one from the newer one and what is left is change: a slip scar, a sheet of flood silt, a river that moved, a coast pushed up by an earthquake. Red below is ground that went down, blue is ground that came up, and differences under ±0.3 m are left clear as survey noise.
Esk Valley: buried under Cyclone Gabrielle’s silt
Eskdale, Hawke’s Bay · 2020–2021 and 2023–2024 Hawke’s Bay LiDAR
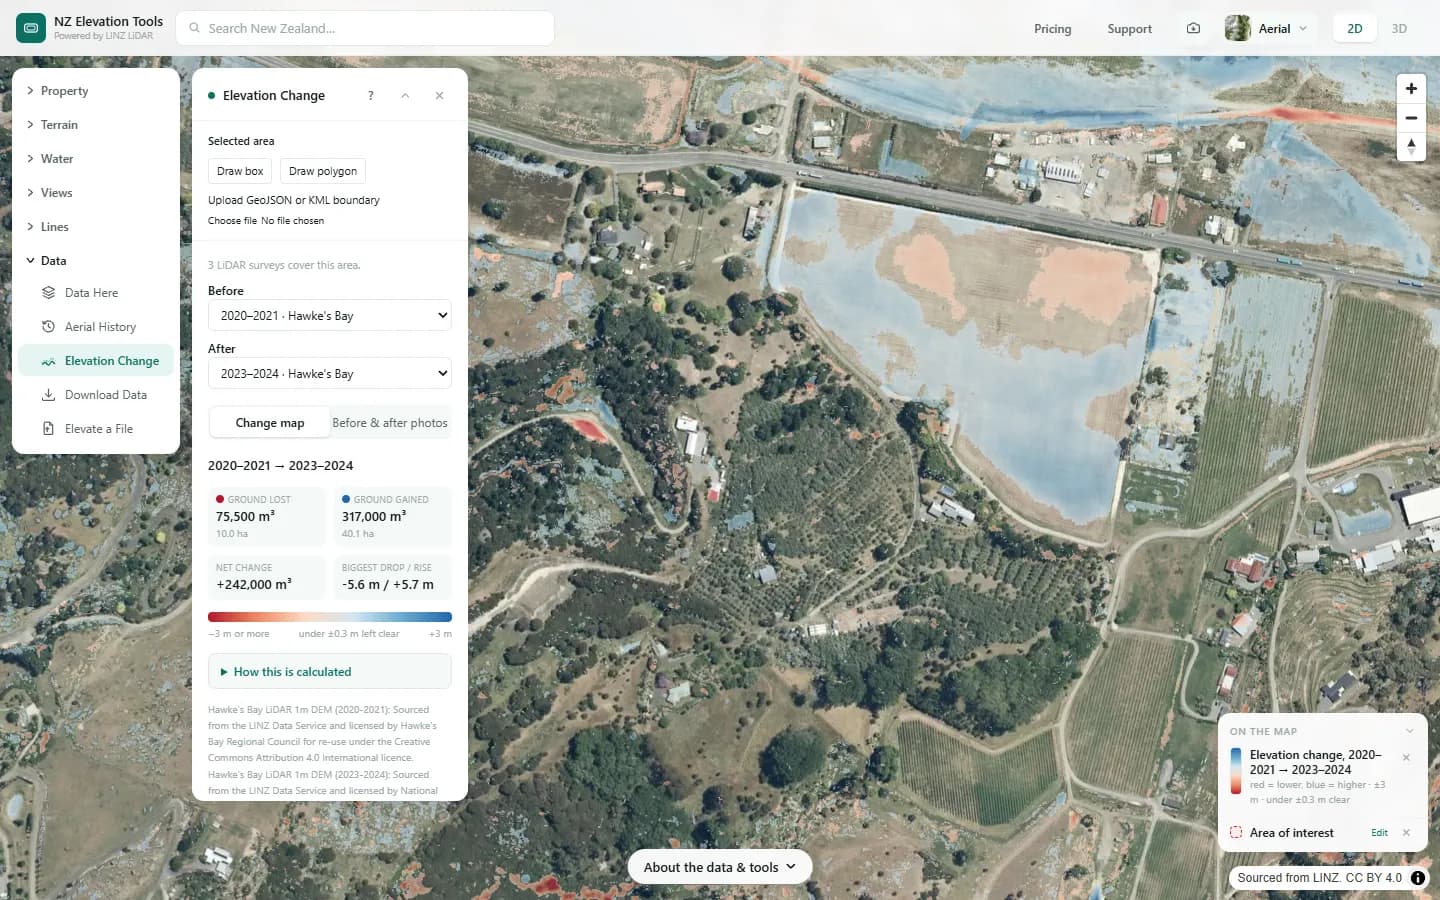
When the Esk River broke out during Cyclone Gabrielle in February 2023 it left orchards, vineyards and houses under silt. Subtracting the 2020–2021 LiDAR from the 2023–2024 survey measures it: across this 1.5 km stretch the ground rose by about 317,000 m³ over 40 hectares, up to 5.7 m in places, and the paddock beside the highway is the blue sheet at the top.
Red marks where ground was lost: about 75,500 m³, mostly scour along the stream and road edges. Across the whole box the median change is only 4 cm, so the two surveys line up well on ground that didn’t move, which is what makes the rest believable.
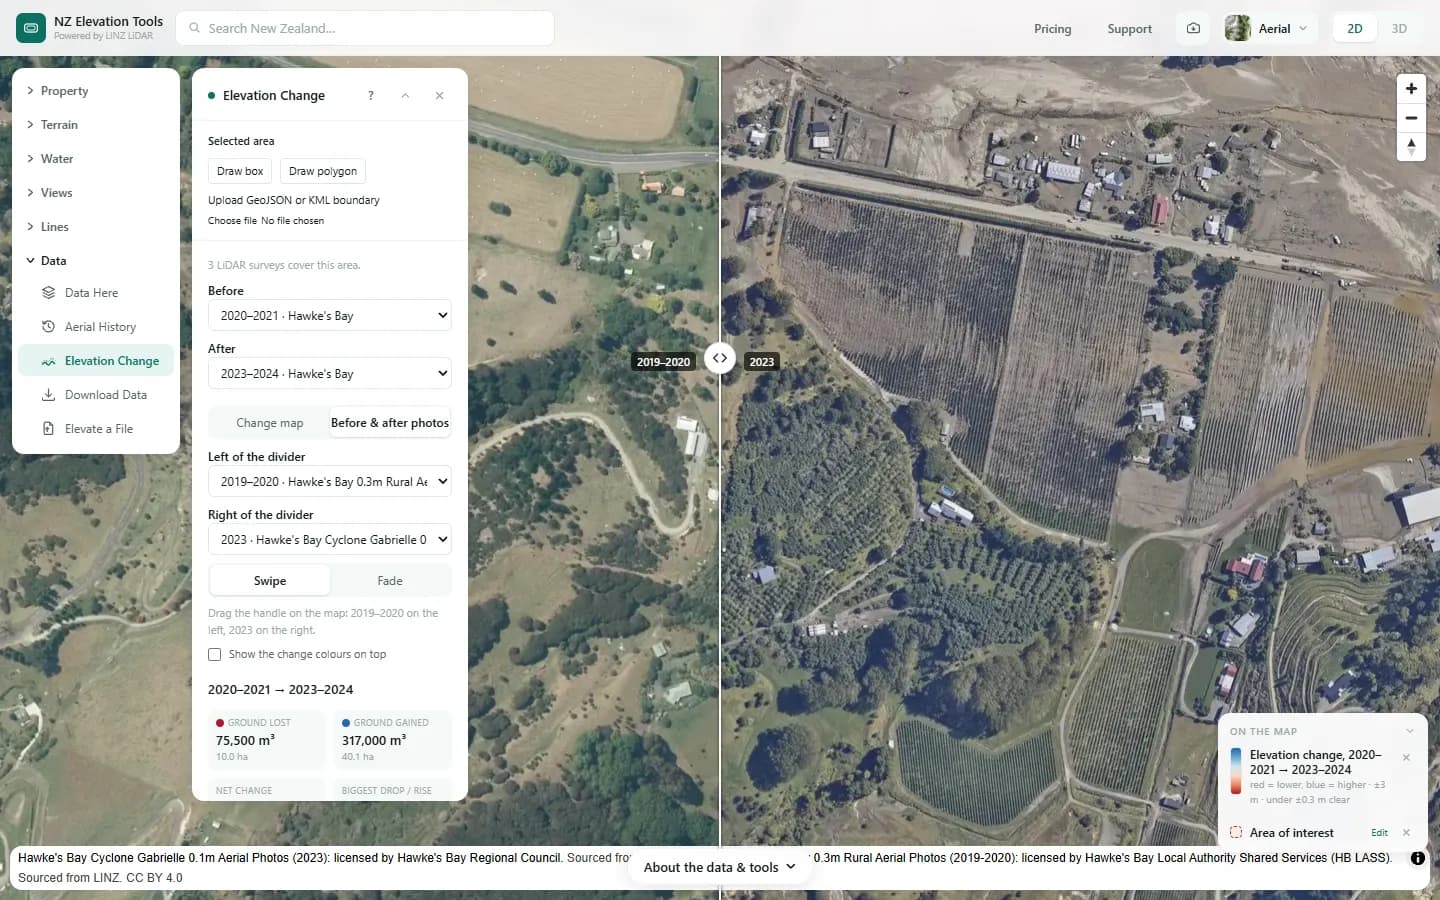
LiDAR: Hawke's Bay LiDAR 1m DEM (2020-2021) and Hawke's Bay LiDAR 1m DEM (2023-2024). Sourced from the LINZ Data Service and licensed by Hawke's Bay Regional Council and National Institute of Water and Atmospheric Research for re-use under the Creative Commons Attribution 4.0 International licence. Photos: Hawke's Bay 0.3m Rural Aerial Photos (2019-2020): licensed by Hawke's Bay Local Authority Shared Services (HB LASS); Hawke's Bay Cyclone Gabrielle 0.1m Aerial Photos (2023): licensed by Hawke's Bay Regional Council.
Hikuwai River: banks cut back, flats under silt
Mangatuna, north of Tolaga Bay, Tairāwhiti · 2018–2020 and 2023 Gisborne LiDAR
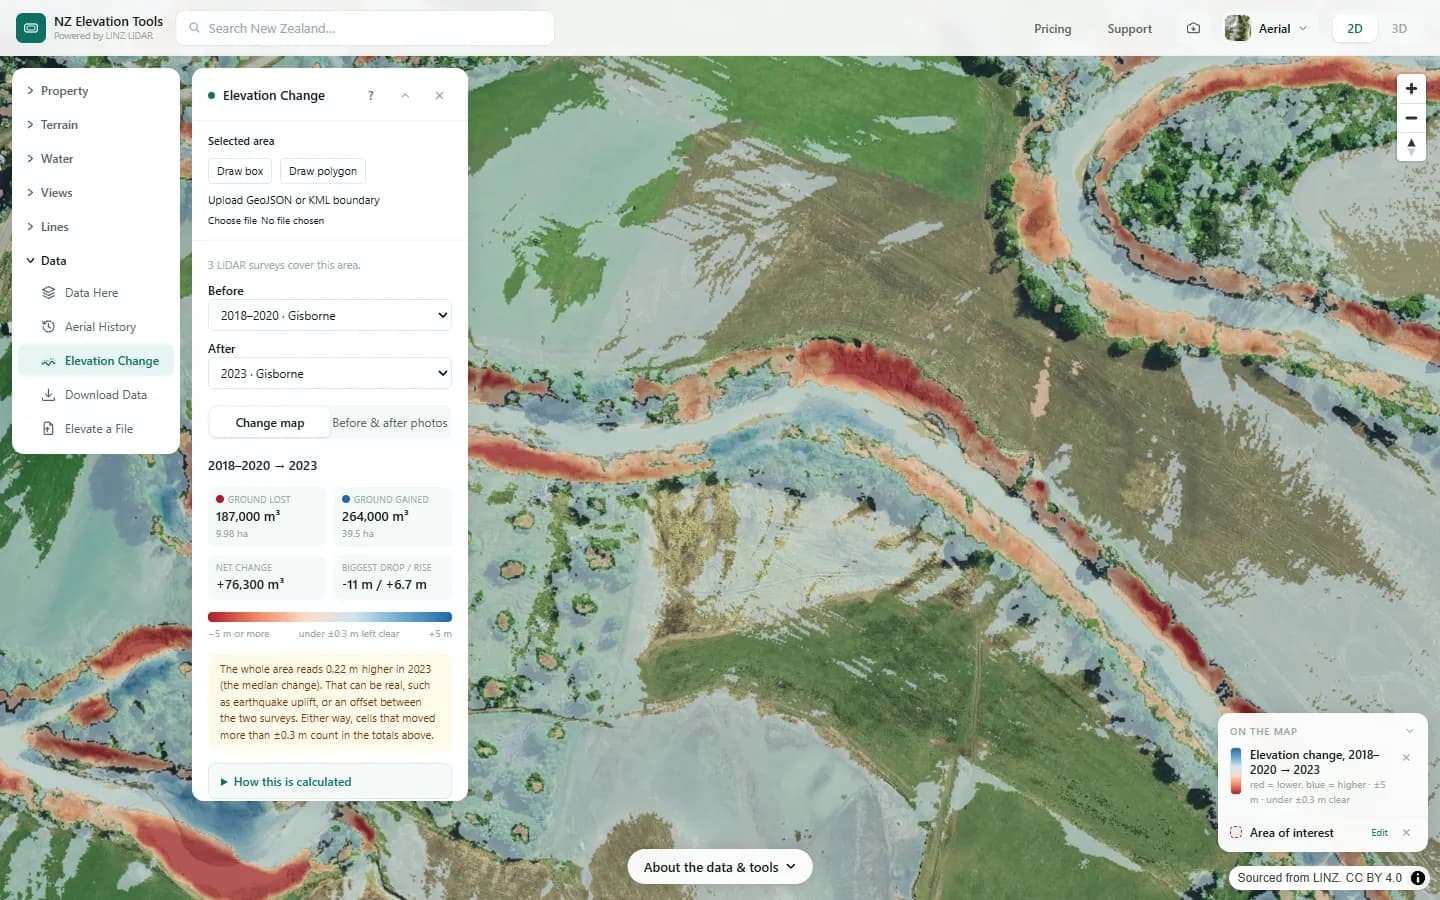
Where the Mangatokerau River meets the Hikuwai, Gabrielle’s floods did two things at once. The red bands are river banks cut back by up to 11 m, about 187,000 m³ of ground gone. The blue is where that material and more came to rest: about 264,000 m³ of silt spread over 40 hectares of river flats.
The photos tell the same story from above: green paddocks in 2017–2019, grey silt to the hedgerows in 2023–2024, and the river running along a new edge.
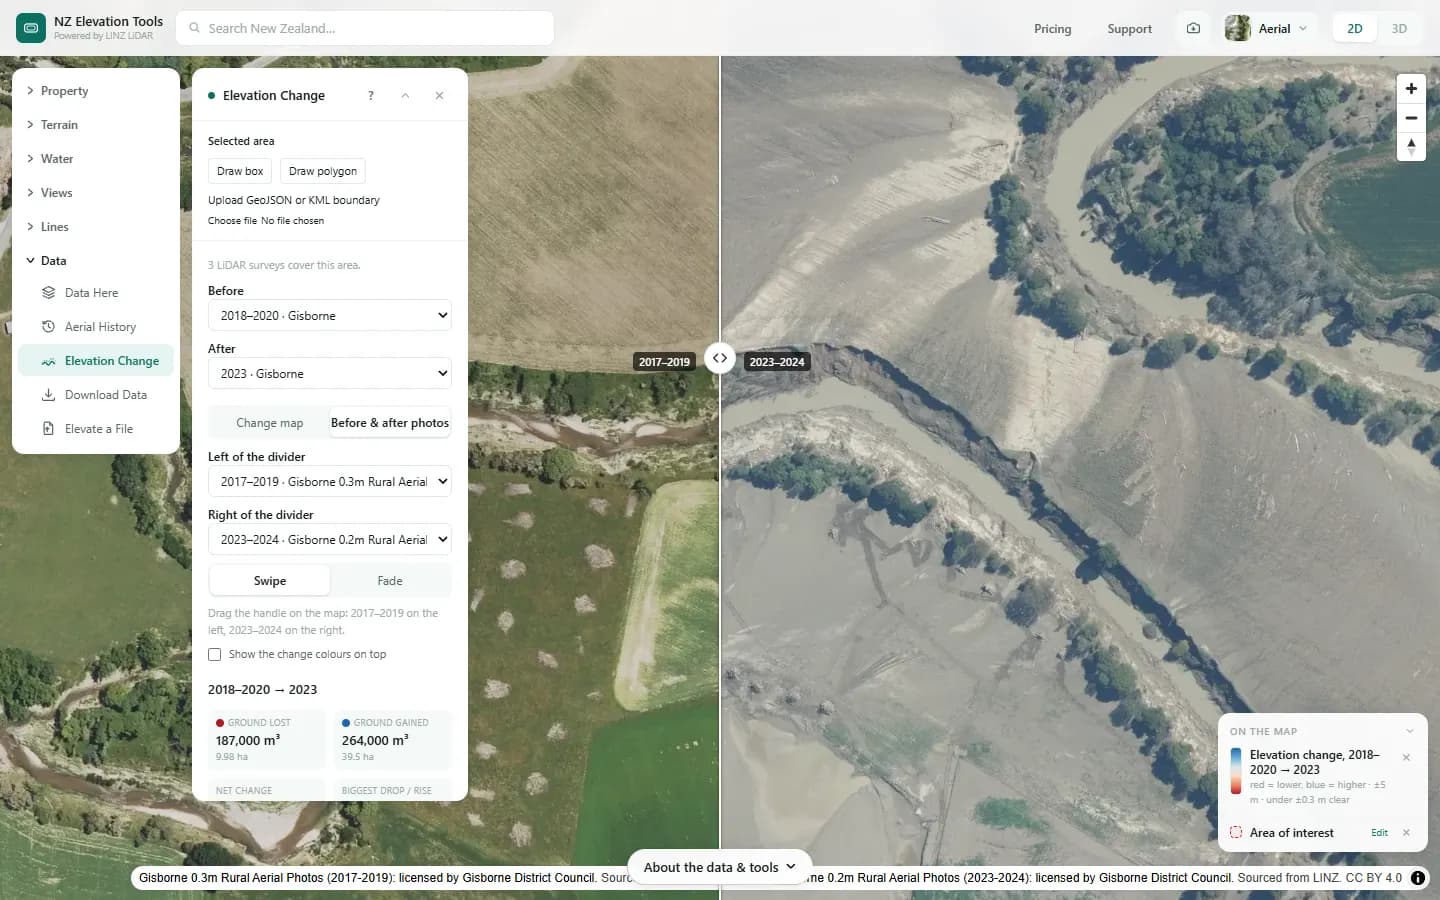
LiDAR: Gisborne LiDAR 1m DEM (2018-2020) and Gisborne LiDAR 1m DEM (2023). Sourced from the LINZ Data Service and licensed by Gisborne District Council and National Institute of Water and Atmospheric Research for re-use under the Creative Commons Attribution 4.0 International licence. Photos: Gisborne 0.3m Rural Aerial Photos (2017-2019): licensed by Gisborne District Council; Gisborne 0.2m Rural Aerial Photos (2023-2024): licensed by Gisborne District Council.
Waipapa Bay: the coast lifted out of the sea
North of Kaikōura, Canterbury · 2012 and 2016–2017 Kaikōura LiDAR
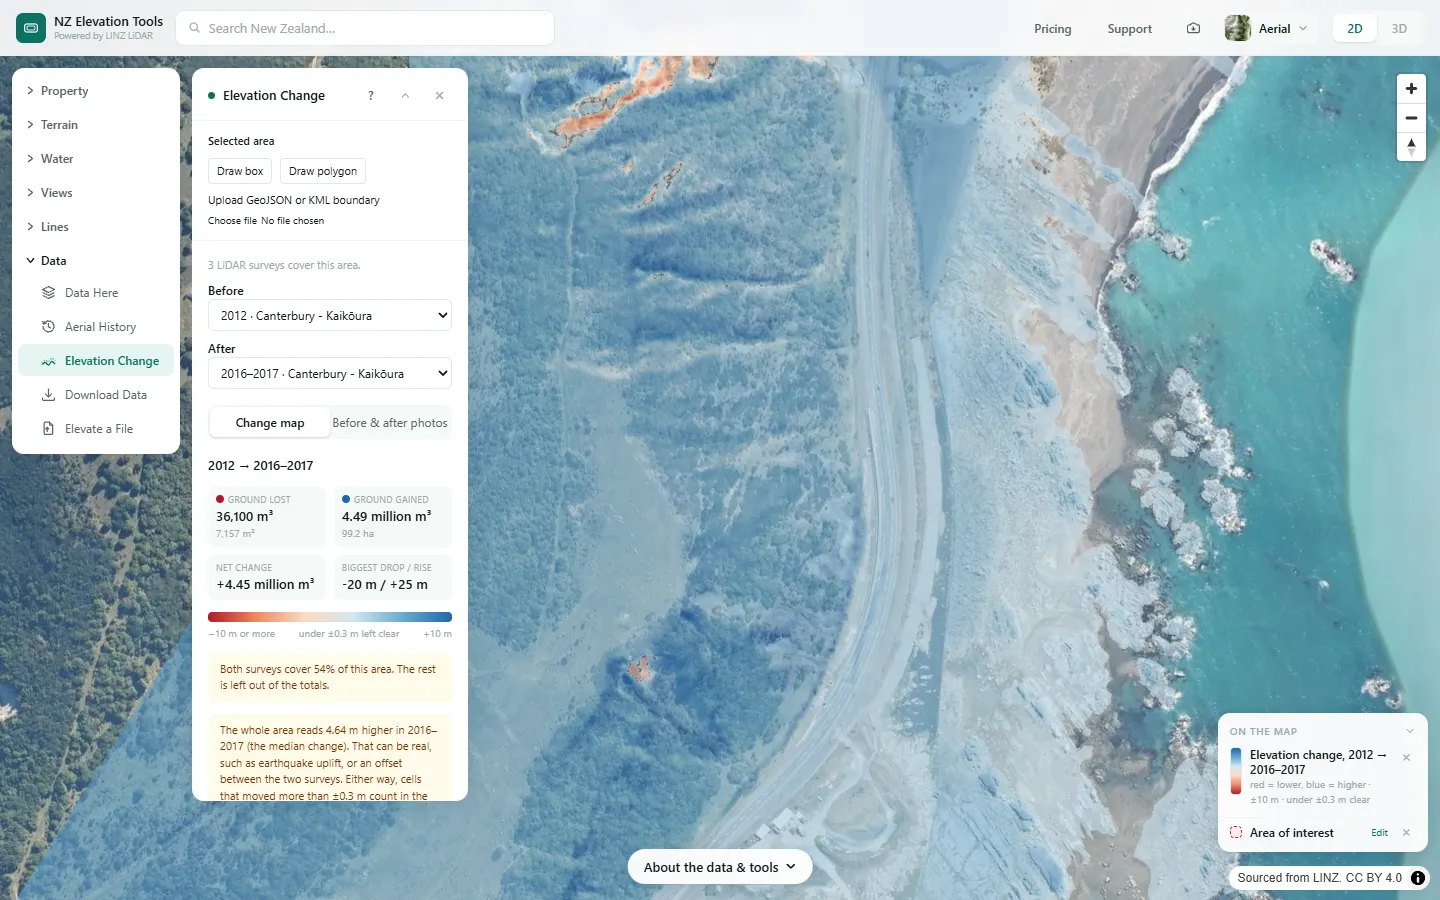
The magnitude 7.8 Kaikōura earthquake of 14 November 2016 pushed parts of this coast metres into the air. Here everything is blue: the ground both surveys cover reads a median 4.6 m higher in 2016–2017 than in 2012, about 4.5 million m³ over a kilometre of coast. The panel flags it, because a shift across a whole area can also be an offset between surveys. Here it is the uplift.
The 2012 survey only flew a strip along the coast, so the comparison covers about half of the box. In the photos, surf breaks over the reef in 2000; in the 2016 earthquake photos the same reef sits high and dry, a new shore platform.
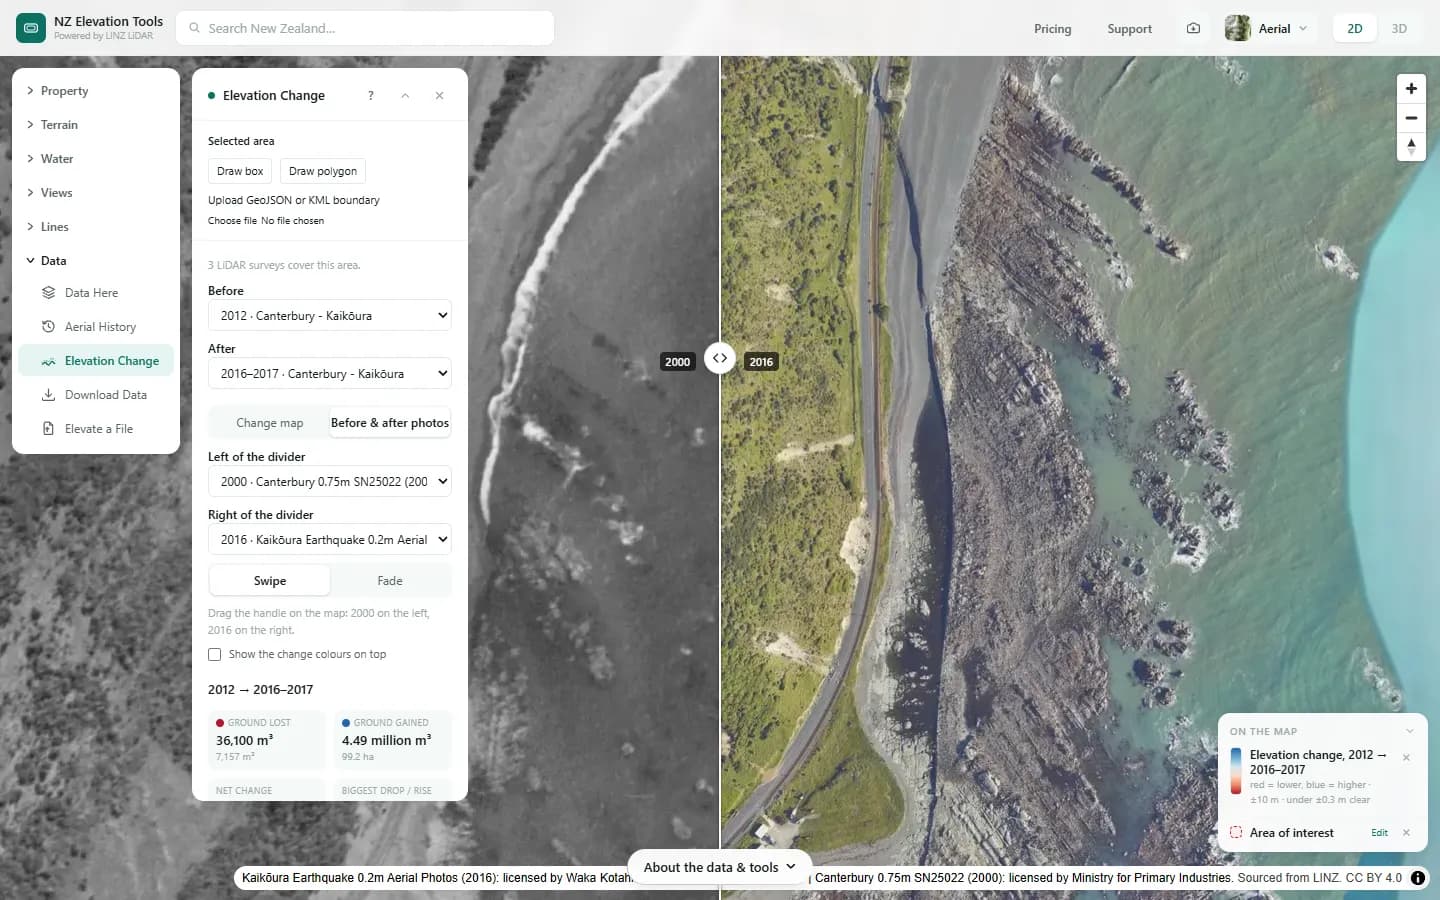
LiDAR: Canterbury - Kaikōura LiDAR 1m DEM (2012) and Canterbury - Kaikōura LiDAR 1m DEM (2016-2017). Sourced from the LINZ Data Service and licensed by Environment Canterbury and Toitū Te Whenua Land Information New Zealand for re-use under the Creative Commons Attribution 4.0 International licence. Photos: Canterbury 0.75m SN25022 (2000): licensed by Ministry for Primary Industries; Kaikōura Earthquake 0.2m Aerial Photos (2016): licensed by Waka Kotahi.
Compare two surveys anywhere they overlap
Frame an area up to 2 km across, or pick a parcel, and choose two survey years. Free to use, no account.
Open Elevation Change →How to read a change map
- Flood silt shows as broad, even blue sheets on flat land.
- Slips show as a red scar on the slope with a blue fan or lobe below it, where the material came to rest.
- River erosion is a red band along the outside of a bend, often with blue on the inside where gravel built up.
- Uplift or subsidence turns a whole area one colour, and the panel says by how much.
- Speckle under forest is noise: the ground under dense canopy is measured less well. Trust broad, consistent patches.
Take it further
Every comparison can be shared as a link, and the change itself downloads as a 1 m GeoTIFF for QGIS or ArcGIS.
Related guides
- LiDAR coverage in New Zealand — which surveys cover an address, and when they were flown.
- Terrain checks before buying rural land — seven checks for a lifestyle block.
- Overland flow paths — where water runs across a section in heavy rain.
Frequently asked questions
Can I do this for my own property?
Where LINZ has flown the same ground at least twice, yes. Open Elevation Change, frame an area up to 2 km across or pick a parcel, and the panel lists the LiDAR surveys there. Much of Hawke’s Bay, Gisborne, Canterbury, Wellington and Auckland has been flown more than once. Data Here shows which surveys cover a spot.
How accurate are the volumes?
Each LiDAR survey is accurate to roughly ±0.1–0.2 m in height, so differences under ±0.3 m are treated as noise and left out. The volumes are good for scale and for comparing places, not a substitute for a surveyed volume. Dense bush, water and steep faces are the least reliable: under forest you see speckle that is not real change.
Why does a new house not show up?
The comparison uses bare-earth LiDAR, which has buildings and trees removed. New houses and felled forest mostly don’t show; the earthworks under them do.
Can I get the data?
Comparing on the map and the before-and-after photos are free. The change itself, every 1 m cell as a GeoTIFF in NZTM2000 for GIS, is a paid download. The underlying LiDAR is free from LINZ under CC BY 4.0.