Data · Select an area up to 2 km across
See how the ground has changed between two LiDAR surveys
LiDAR change detection for NZ, free on the map: where LINZ has flown the same ground more than once, compare any two surveys and see where the ground dropped or rose between them: Cyclone Gabrielle slips and silt in Hawke’s Bay and Tairāwhiti, the 2016 Kaikōura uplift, quarries, fill and river gravel.
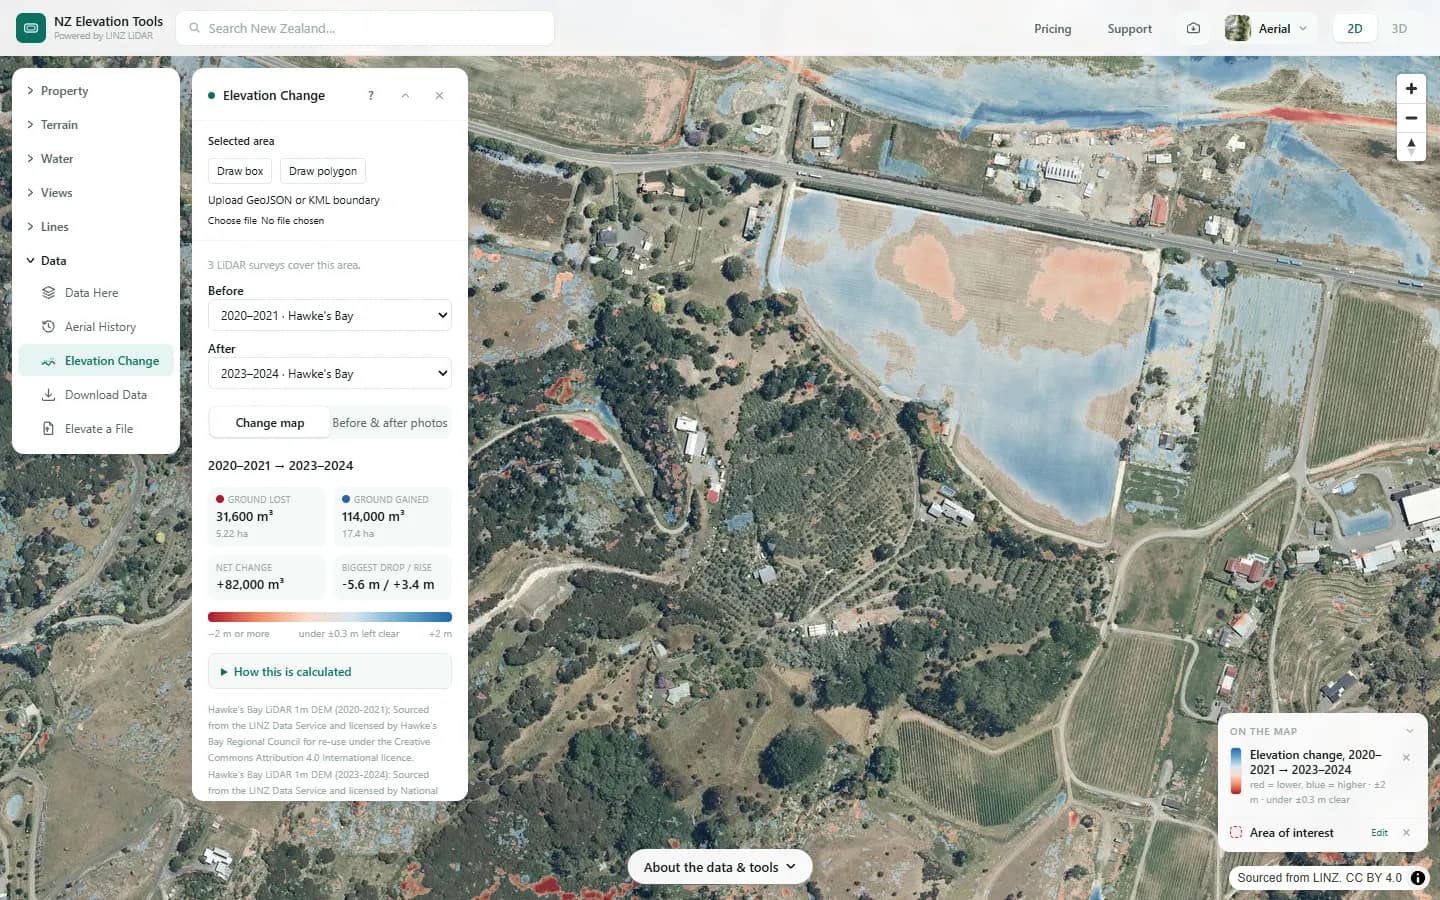
Choose an area up to 2 km across and two survey years. The map shades loss red and gain blue at the full 1 m detail, and the panel gives the volume of ground lost and gained, leaving out differences small enough to be survey noise.
Free to run · pay to download
See the full result on the map free, with no account. Download GeoTIFF of the change, 1 m in NZTM2000 with a pass: NZ$49 for 7 days or NZ$299 for 12 months, one-off, GST included, not a subscription. Every download on the site is included while the pass lasts.
Who uses this
- Buyers and owners. Check whether a property has slipped, been filled or been cut since an earlier survey.
- Engineers and geotechnical consultants. Get a first look at slip volumes and deposition before ordering a survey.
- Councils and catchment groups. See how far river silt and gravel built up after a flood.
When to use it
- You want to see what a slip, flood or storm did to the ground, such as Cyclone Gabrielle in Hawke’s Bay and Tairāwhiti.
- You want to know whether a site has been filled, cut or quarried since an earlier survey.
- You want to measure how far a riverbed, beach or dune has built up or eroded.
Which tool for your job
Elevation Change is one step in a bigger question. These are the jobs it helps with, and the tools that go with it.
If you’re working on buying a section or lifestyle block
What is the ground like, and how does it compare with the others on my list?
- 1.Property — Selects the legal parcel so every other tool is clipped to the boundary.
- 2.Property Report — A PDF with contours, slope, aspect, winter sun, drainage, elevation and old aerial photos for that parcel, or several selected together.
- 3.Saved Properties — Up to five places side by side: elevation, slope, winter sun and drainage.
- 4.Flow Paths — Where water will run and pond across the block in heavy rain.
- 5.Aerial History — Old aerial photos back to the 1930s in places: past slips, filled gullies and streams that have since gone.
- 6.Elevation Change (this tool) — Where LiDAR was flown twice: whether the ground has slipped, been filled or been cut since.
How to use it
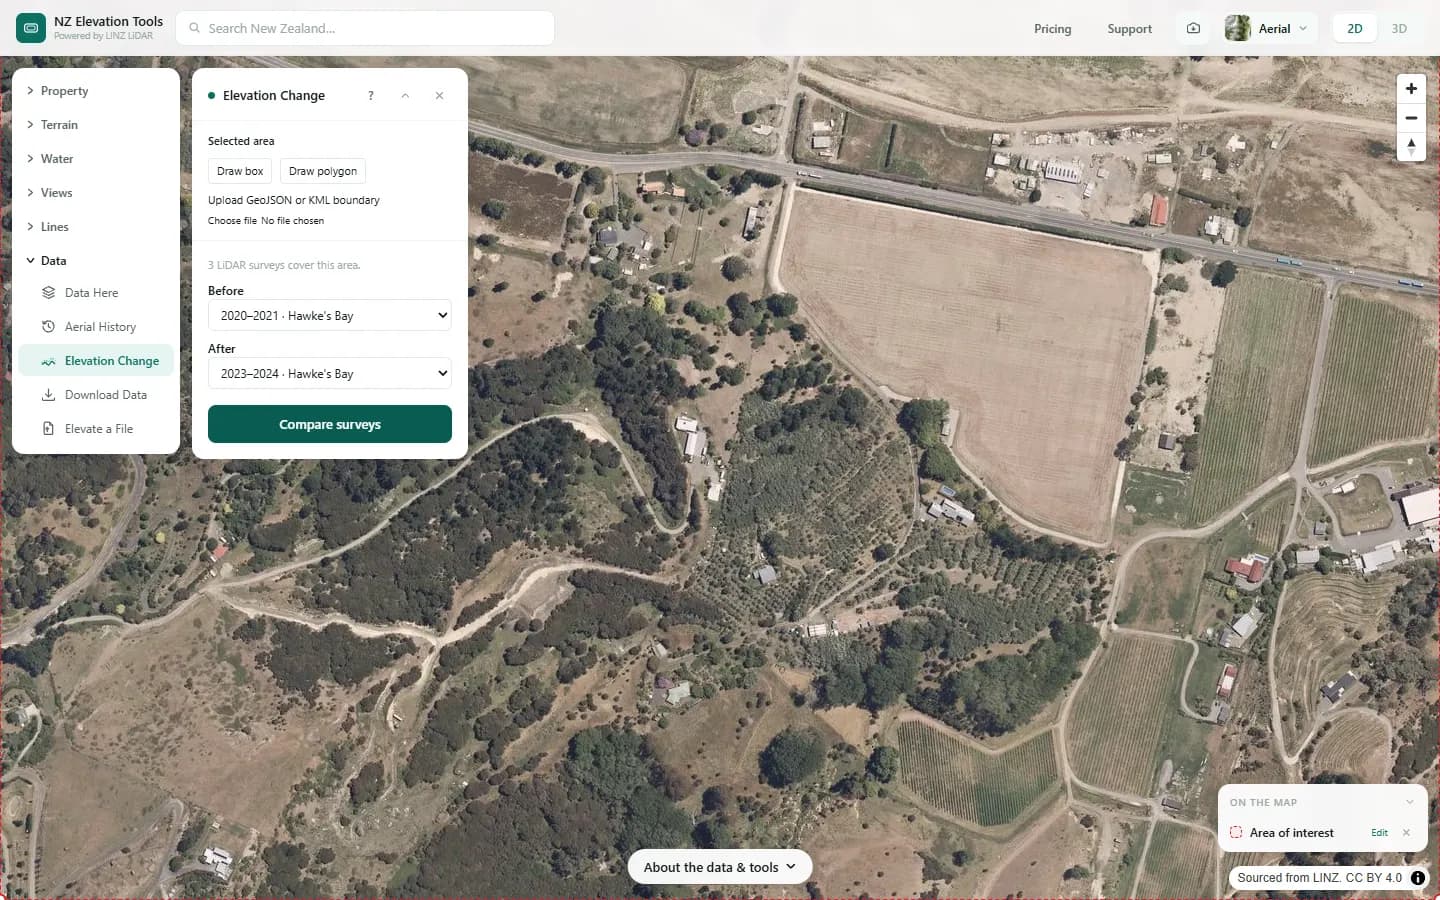
- Open Elevation Change and frame the area on the map, draw a box, or select a parcel with the Property tool. Areas can be up to 2 km across.
- The panel lists the LiDAR surveys that cover the area and picks the oldest and newest. Change either one if you want a different pair.
- Choose Compare surveys. Red shows where the ground went down, blue where it went up, and the panel gives the volumes.
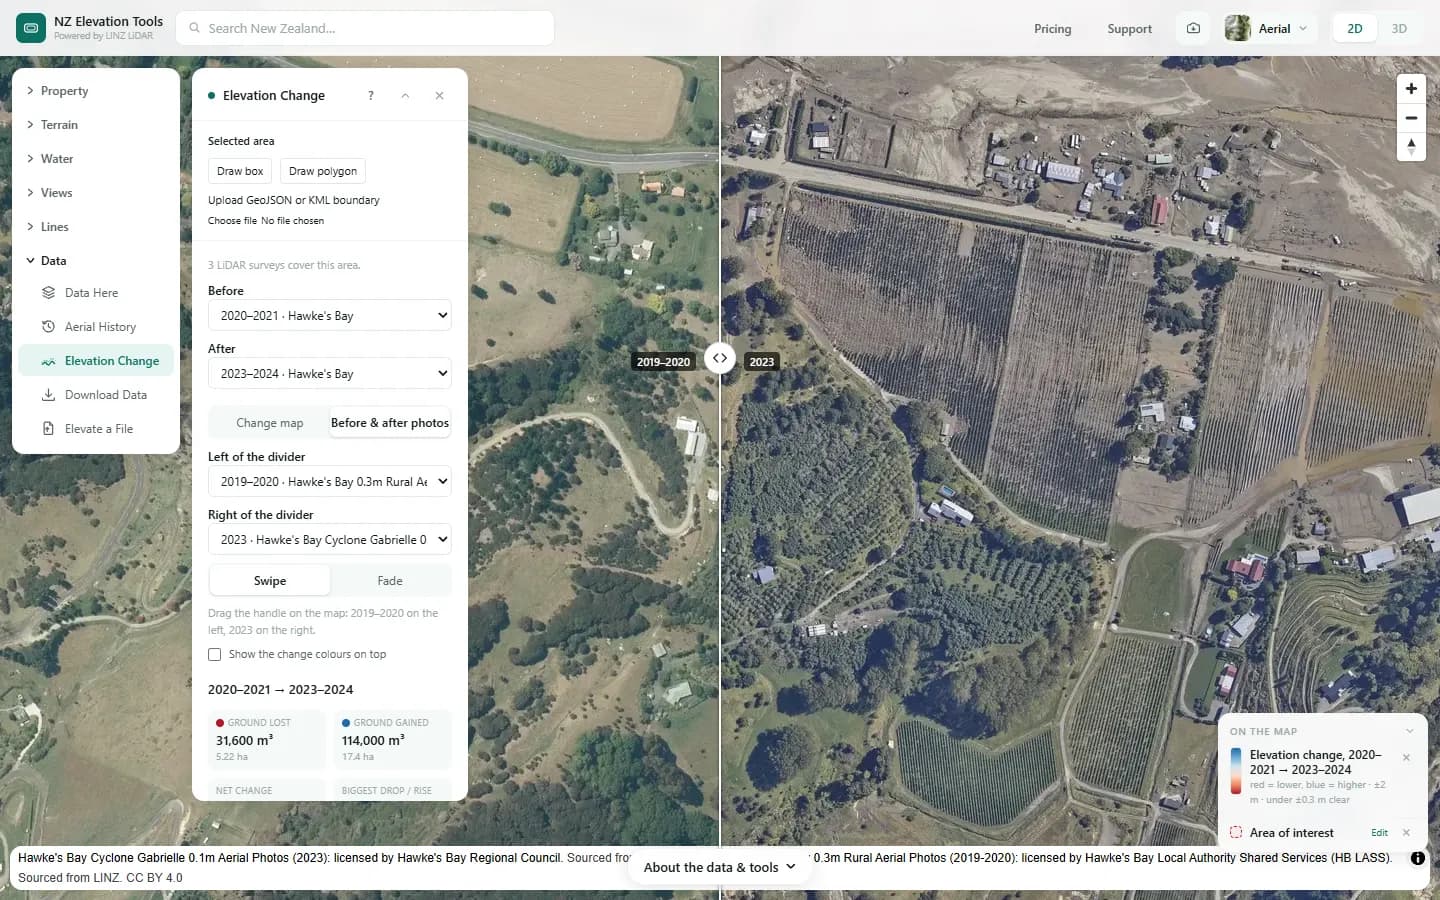
- Choose Before & after photos to swipe between an aerial photo from around the earlier survey and one from around the later survey. Either photo can be changed, and the change colours can be laid over them.
Step by step: Mt Iron, Wānaka
We compare the Esk Valley near Eskdale, Hawke’s Bay, before and after Cyclone Gabrielle buried its orchards in silt in February 2023.
What it showed
- Flood silt shows as broad blue sheets on flat land; slips as a red scar above a blue deposit.
- Speckle under dense bush is survey noise, not change. Trust broad, consistent patches.
Screenshots from NZ Elevation Tools. Aerial imagery from LINZ Basemaps. Sourced from the LINZ Data Service and licensed by Environment Southland, Otago Regional Council and Queenstown-Lakes District Council for re-use under the Creative Commons Attribution 4.0 International licence.
How it works
Both surveys’ 1 m bare-earth elevation models are read straight from LINZ’s open LiDAR archive for the area. LINZ holds every survey on the same 1 m NZTM2000 grid in NZVD2016 heights, so each cell is compared with the same cell, with no resampling.
Each cell’s change is the later height minus the earlier one. Changes smaller than ±0.3 m are treated as survey noise and left out, because two surveys of unchanged ground typically disagree by up to that much. Volumes add up the change in every remaining 1 m² cell.
Reading the results
Red is lower in the later survey, blue is higher. The colour is darkest at the change shown under the colour bar; bigger changes are the same colour.
Ground lost and gained are separate totals, so a slip that moved earth downhill shows both: a red scar and a blue deposit.
If the whole area reads higher or lower, the panel says by how much. That can be real, like the uplift at Kaikōura in 2016, or an offset between the two surveys.
Limits and warnings
- Only where LINZ has flown the same ground at least twice. Data Here shows which surveys cover a spot.
- Bare-earth LiDAR has buildings and trees removed, so new houses or felled forest mostly don’t show; the earthworks under them do.
- Water surfaces, dense bush and steep faces are the least reliable. Treat small changes there with caution.
- Volumes are estimates from two separate surveys, good for scale and comparison, not a substitute for a surveyed volume.
- Comparing on the map is free. The change GeoTIFF, 1 m in NZTM2000, needs a pass.
Compare quotes without ringing around
Elevation Change gives you a fast, indicative answer. When the job needs pricing, designing or signing off, getting quotes usually means calling around and explaining the same site over and over. Instead, run the tool on your site and choose Compare quotes under the result. Describe the job once and we’ll send it to up to 3 local geotechnical engineers or surveyors, with an aerial map of the site, a Google Earth file and your results attached, so they can price it properly from the start. They quote you directly. It’s free and there’s no obligation.
Data and attribution
Heights come from each survey’s own 1 m bare-earth DEM, read in your browser straight from LINZ’s open LiDAR archive (cloud-optimised GeoTIFFs on the 1 m NZTM2000 grid, NZVD2016 heights), cell for cell with no resampling. Not the elevation tiles the other map tools read. The photos come from LINZ Basemaps.
Elevation and cadastral data is sourced from the LINZ Data Service and licensed for re-use under the Creative Commons Attribution 4.0 International licence. Copyright in each LiDAR survey belongs to the body that commissioned it — a regional or district council, Waka Kotahi, NIWA and around thirty others — rather than to LINZ, which hosts and processes the national dataset. Every file exported from this site names the licensors whose surveys cover the area, and anything you publish from those files carries the same attribution requirement. See https://www.linz.govt.nz/products-services/data/licensing-and-using-data/attributing-elevation-or-aerial-imagery-data
Questions
Where can I use it?
Anywhere LINZ has flown 1 m LiDAR over the same ground at least twice, including much of Hawke’s Bay, Gisborne, Canterbury, Wellington and Auckland. Data Here shows which surveys cover a spot.
How accurate are the volumes?
Each LiDAR survey is accurate to roughly ±0.1–0.2 m in height, so the tool ignores differences under ±0.3 m. Volumes are good for scale and comparison, not a substitute for a surveyed volume.
Ready to try it?
Open Elevation Change on the map →Free to use, no account. Runs in your browser on LINZ open data, including building the change GeoTIFF. Downloading the results needs a pass: see prices.
Missing something you need? Suggest a feature or ask about custom work.