Data · Click a point
When was this land surveyed? LiDAR, coastal and aerial photo history
See the LiDAR survey history for any spot in New Zealand: click the map and the tool lists every LINZ 1 m LiDAR survey that covers it, the years it was flown and the council that licensed it, along with coastal surveys that measured the seabed.
The same click lists the aerial photo surveys there, from historic scanned photos as far back as 1938 to recent urban and rural imagery, grouped by decade.
Free to run · pay to download
Free to run, and free to save as a PNG image of the map. This tool has no file export of its own. For the terrain as a file, Download Data exports contours, a GeoTIFF or a 3D mesh with a pass: NZ$49 for 7 days or NZ$299 for 12 months.
Who uses this
- Buyers and owners. Check whether the LiDAR behind a contour or flood map predates recent earthworks or a slip.
- Planners and engineers. Find places flown more than once, to compare surveys.
- Researchers. See how far back the aerial photos go before ordering prints.
When to use it
- You want to know how recent the LiDAR is before trusting contours, drainage or a slope map for a site.
- You want to know whether the land has been flown more than once, so the surveys can be compared.
- You want to know how far back the aerial photos go for a property or a stretch of river or coast.
Which tool for your job
Data Here is one step in a bigger question. These are the jobs it helps with, and the tools that go with it.
If you’re working on plans, cad, gis and 3d printing
I need the terrain as a file.
- 1.Data Here (this tool) — Which LiDAR, coastal and aerial photo surveys cover a spot, and when each was flown.
- 2.Download Data — Contours, a GeoTIFF elevation model, a 3D DXF or LandXML ground surface, or a 3D mesh for printing.
- 3.Contour Lines — Contours previewed on the map before you export them.
- 4.Elevate a File — Adds ground elevation to your own GPX, KML, GeoJSON or CSV points.
- 5.Point Elevation — Spot heights at the points you click, for a floor level or a tank, or on a grid across a section, to download.
- 6.Terrain Stats — The highest, lowest and mean ground height of an area, and how the land is spread between them.
How to use it
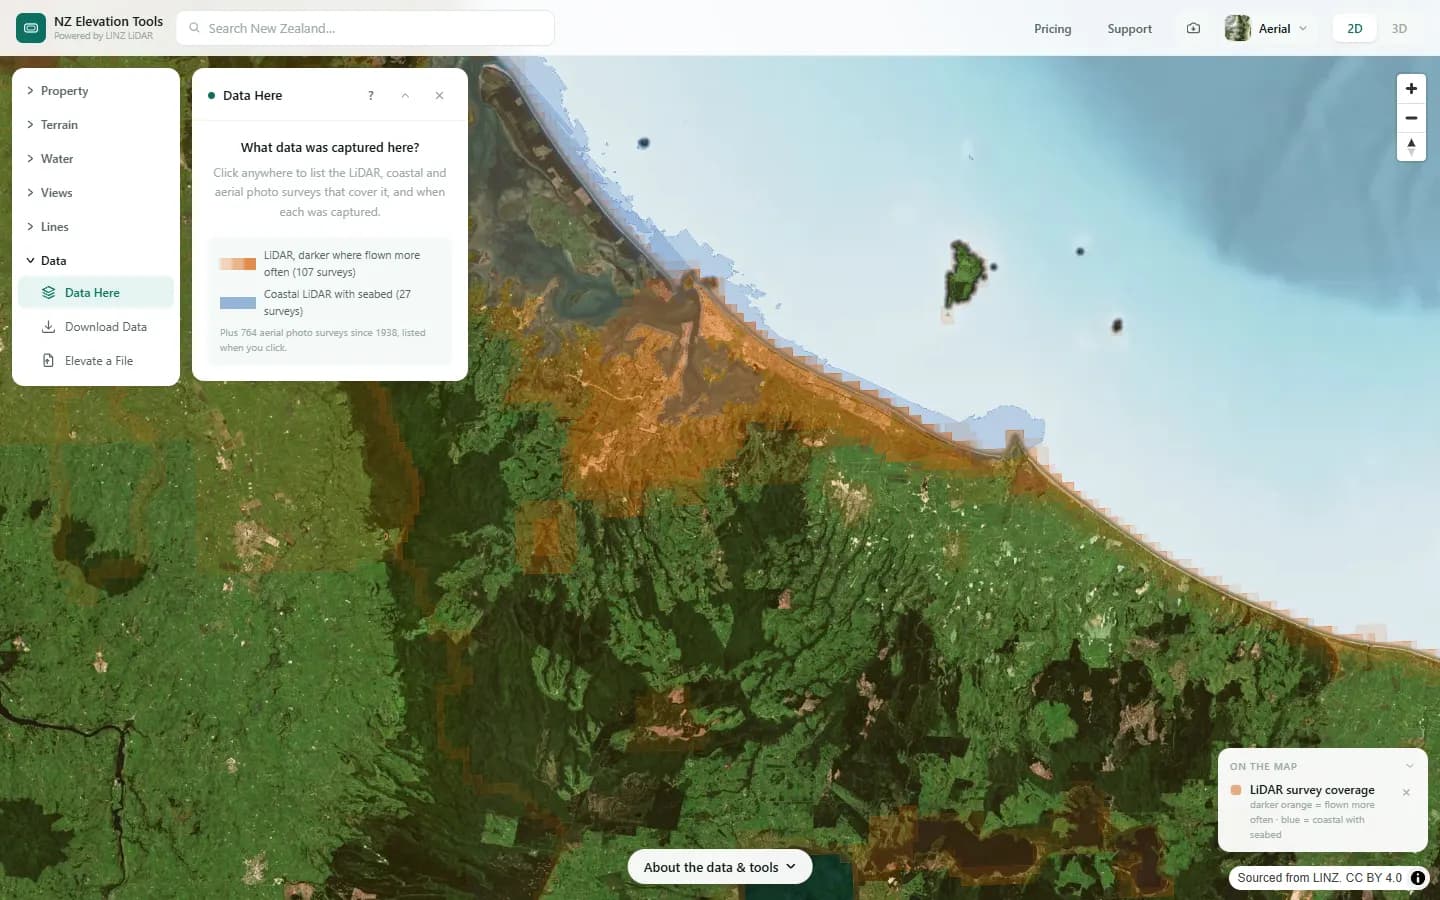
- Open Data Here. The map shades everywhere that has 1 m LiDAR, darker where it has been flown more often, and blue where coastal LiDAR measured the seabed too.
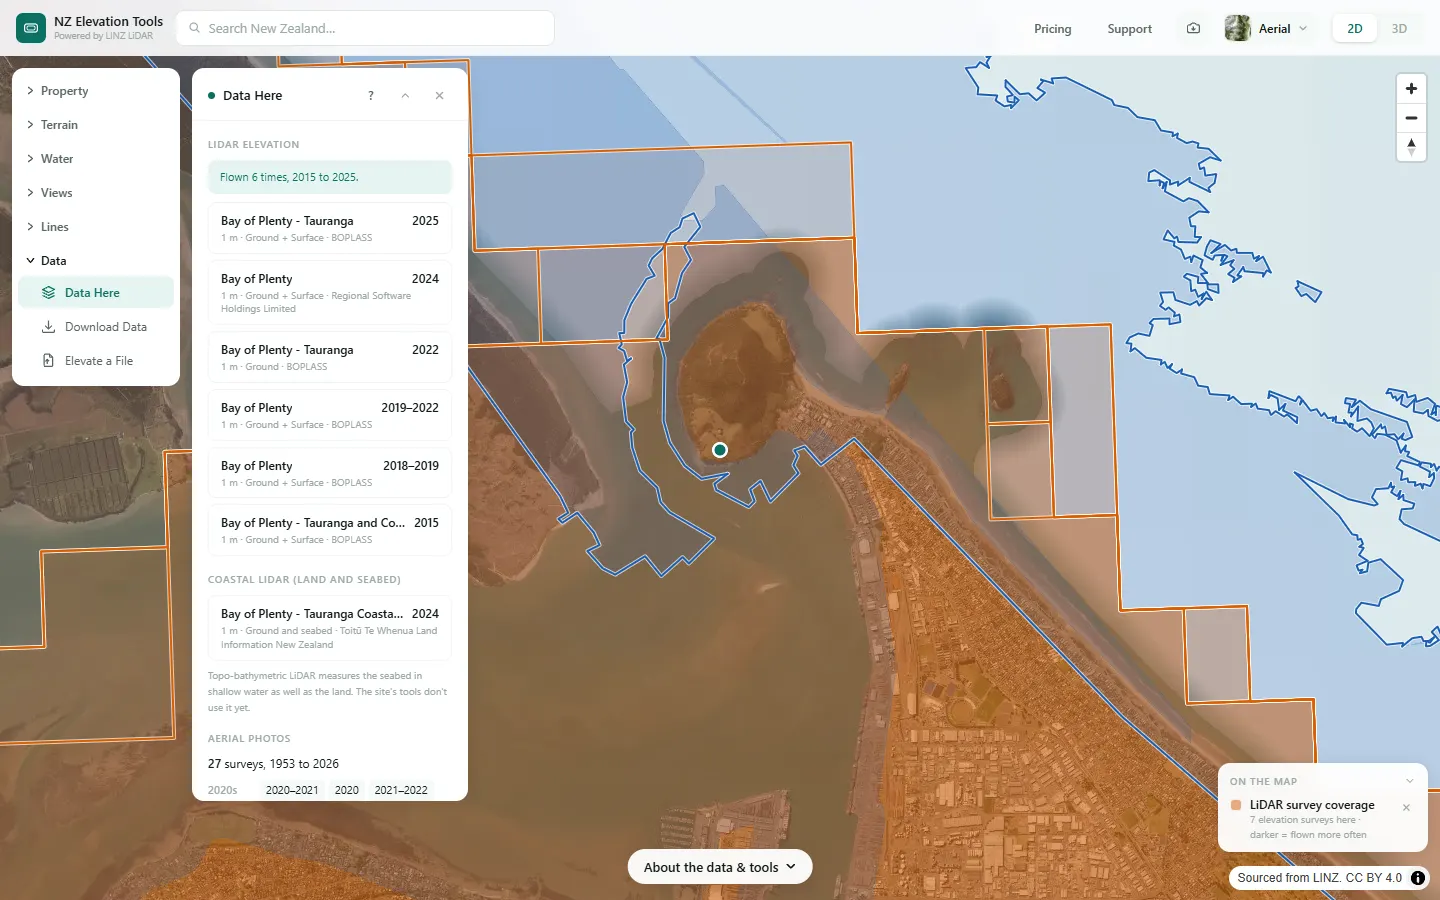
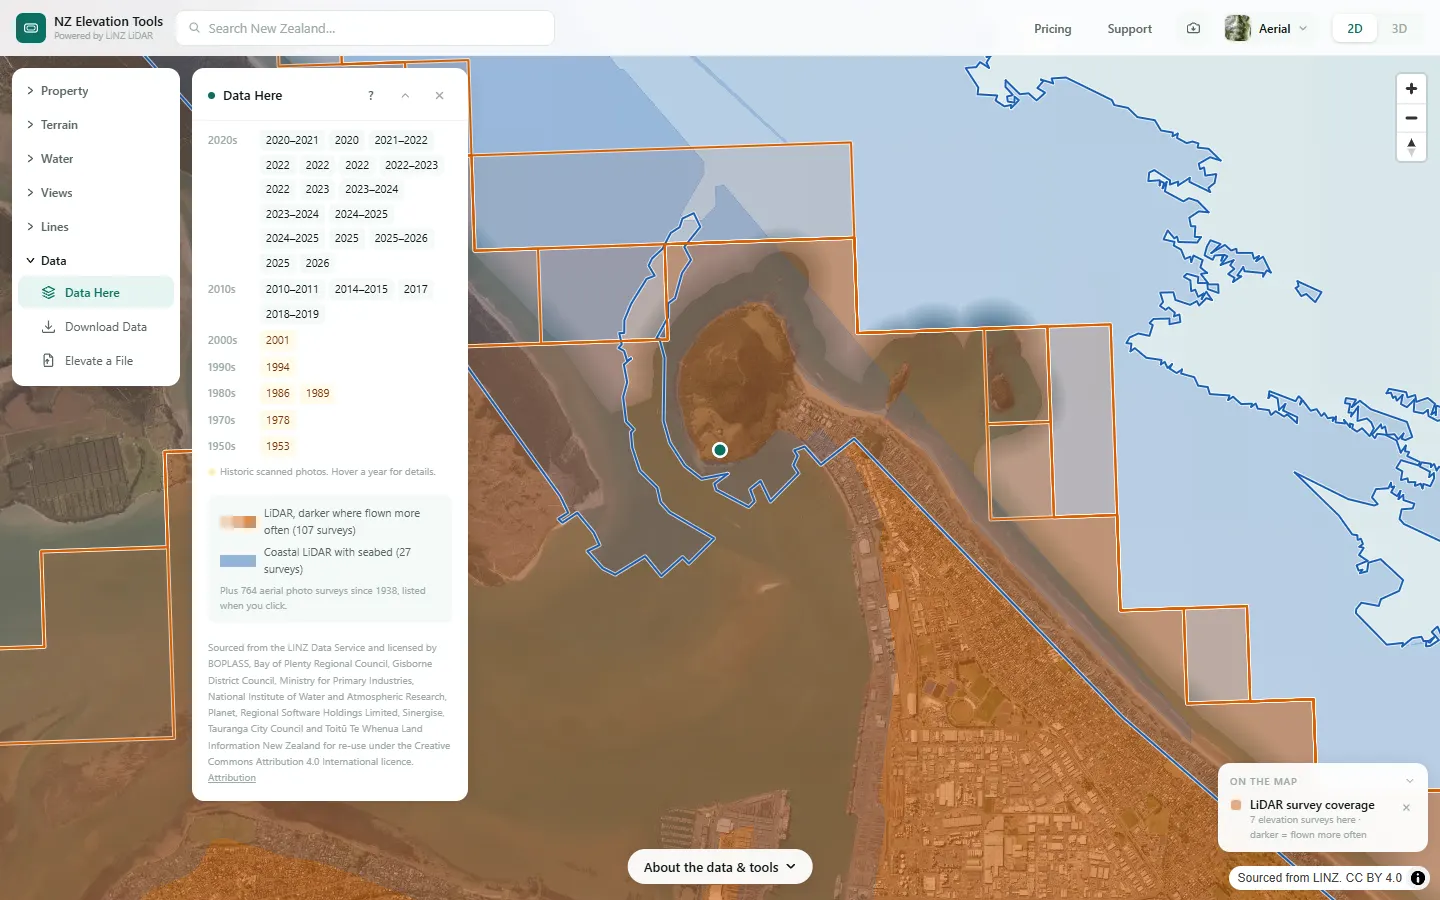
- Click a point. The panel lists every LiDAR and coastal survey there with its capture years and licensor, then every aerial photo survey by decade.
- Hover a year in the photo list for the survey name, type and pixel size.
Step by step: Mt Iron, Wānaka
We check what has been captured at the foot of Mauao, Mount Maunganui.
What it showed
- If the newest LiDAR is older than recent earthworks or a slip, the terrain tools show the ground before it changed.
- Land flown more than once can be compared survey by survey.
Screenshots from NZ Elevation Tools. Aerial imagery from LINZ Basemaps. Sourced from the LINZ Data Service and licensed by Environment Southland, Otago Regional Council and Queenstown-Lakes District Council for re-use under the Creative Commons Attribution 4.0 International licence.
How it works
Each survey has an outline of where data was actually captured, from LINZ’s own capture areas in its elevation, coastal and imagery catalogues. The site checks which outlines contain the clicked point. Nothing is sent to a server, so the answer is instant.
The outlines are simplified to about 20 m for LiDAR and 50 m for photos, and slivers under a hectare are left out to keep them small enough to load quickly.
Reading the results
Years are when the survey was flown, not when it was published. A range such as 2020–2021 means the flying took more than one season.
“Ground” is the bare-earth model the tools use. “Surface” includes trees and buildings. Coastal surveys measure the ground and the seabed in shallow water.
Historic scanned photos are highlighted. They are black-and-white prints scanned by LINZ, often from the 1940s to the 1990s.
Limits and warnings
- Within about 20 m of a survey edge the answer can be wrong either way. Download Data reports how much of an area really came from LiDAR.
- The list is rebuilt from the LINZ catalogues when surveys are added, so a survey LINZ published in the last few weeks may be missing.
- Downloads (Download Data) include the coastal seabed where it exists, as heights below 0 m. The on-map tools don’t use it yet. Seabed heights are not for navigation.
Data and attribution
The surveys come from LINZ’s elevation, coastal LiDAR and imagery catalogues: the outline each survey actually captured, checked against your click in your browser. No heights are read.
Elevation and cadastral data is sourced from the LINZ Data Service and licensed for re-use under the Creative Commons Attribution 4.0 International licence. Copyright in each LiDAR survey belongs to the body that commissioned it — a regional or district council, Waka Kotahi, NIWA and around thirty others — rather than to LINZ, which hosts and processes the national dataset. Every file exported from this site names the licensors whose surveys cover the area, and anything you publish from those files carries the same attribution requirement. See https://www.linz.govt.nz/products-services/data/licensing-and-using-data/attributing-elevation-or-aerial-imagery-data
Questions
Why does it matter when the LiDAR was flown?
Every terrain tool on the site reads the LiDAR. If the newest survey predates a subdivision, a slip or a new driveway, contours and flow paths show the ground as it was then.
What is coastal LiDAR?
Topo-bathymetric LiDAR flown by LINZ along the coast from 2024. It measures the seabed in shallow water as well as the land. The list shows where it exists, and downloads include the seabed as heights below 0 m (not for navigation). The on-map tools do not use it yet.
Ready to try it?
Open Data Here on the map →Free to use, no account. Runs in your browser on LINZ open data.
Missing something you need? Suggest a feature or ask about custom work.