Property terrain report · sample
What a finished property terrain report looks like
Every page of the report the tool built for one real title: CT 665419, Lot 1 DP 8603, a 390 ha hill block in Marlborough. Nothing is mocked up. The maps, the figures and the checklist are what came out of the PDF.
- Title area
- 389.93 ha
- Elevation
- 293–870 m
- Mean slope
- 26.8°
- Mid-winter sun
- 6 h 35 min
The 11 pages
Pages 1 and 2 are the summary: the cover and the five findings. Pages 3 to 8 are one terrain question each, with a map on the left and the figures beside it. Pages 9 and 10 are the checklist of records to pull before you commit, and page 11 says where the data came from and what it can and cannot tell you.
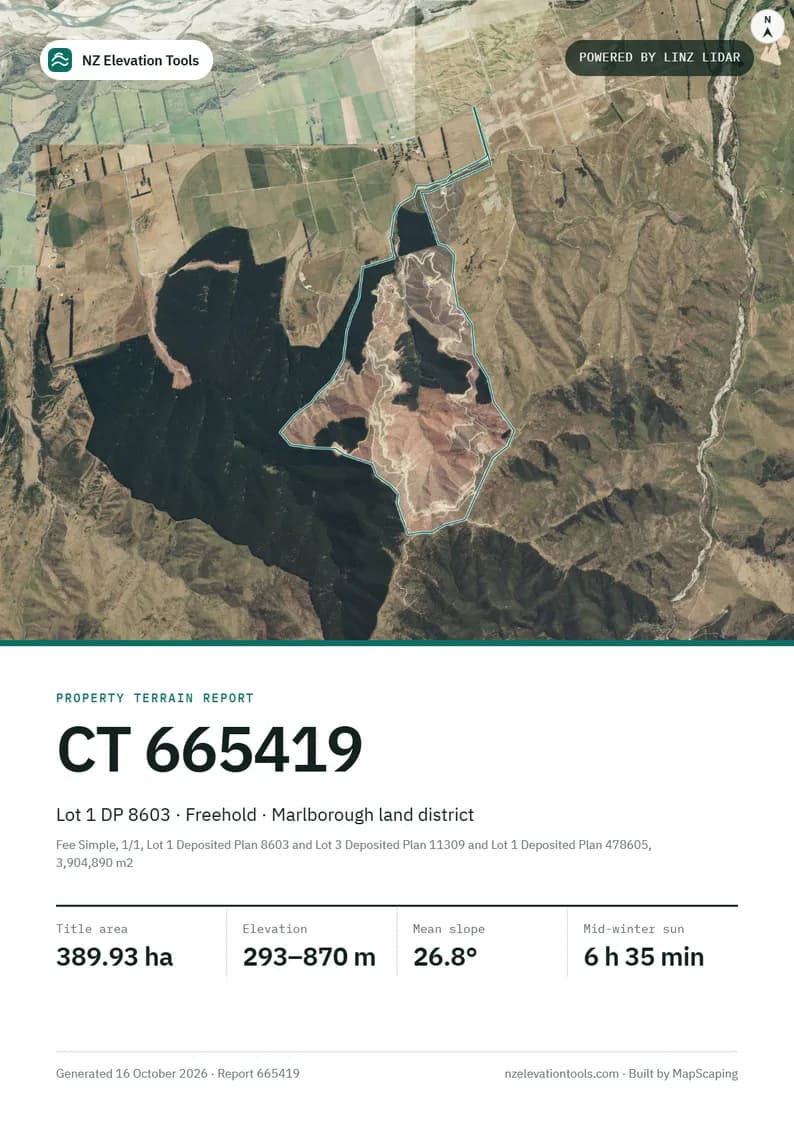
p.1Cover. The title on an aerial photo, with the four numbers that matter most: title area, elevation range, mean slope and direct sun on the shortest day. 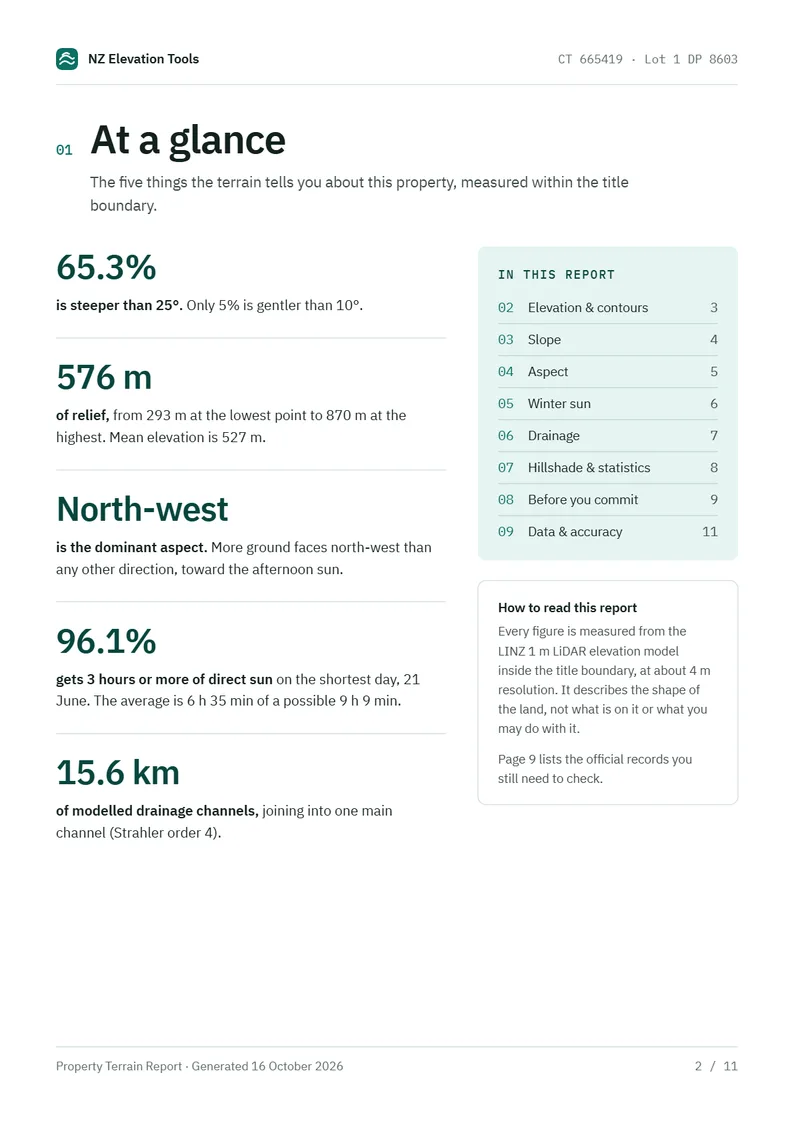
p.2At a glance. Five findings in plain words, each led by its number: 65.3% steeper than 25°, 576 m of relief, north-west facing, 96.1% getting three hours of winter sun, 15.6 km of drainage channels. Contents and a note on how to read the report sit alongside. 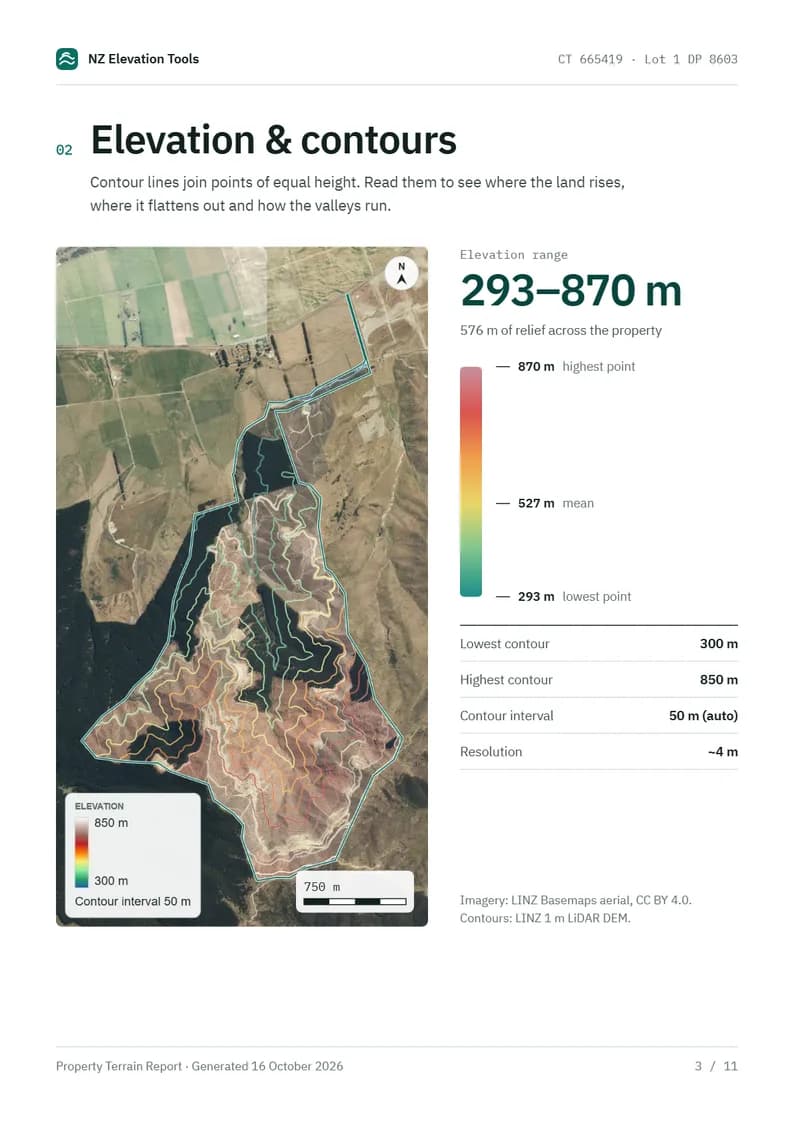
p.3Elevation and contours. Contours at a 50 m interval over the shaded relief, clipped to the title. An elevation ruler marks the lowest point (293 m), the mean (527 m) and the highest (870 m). 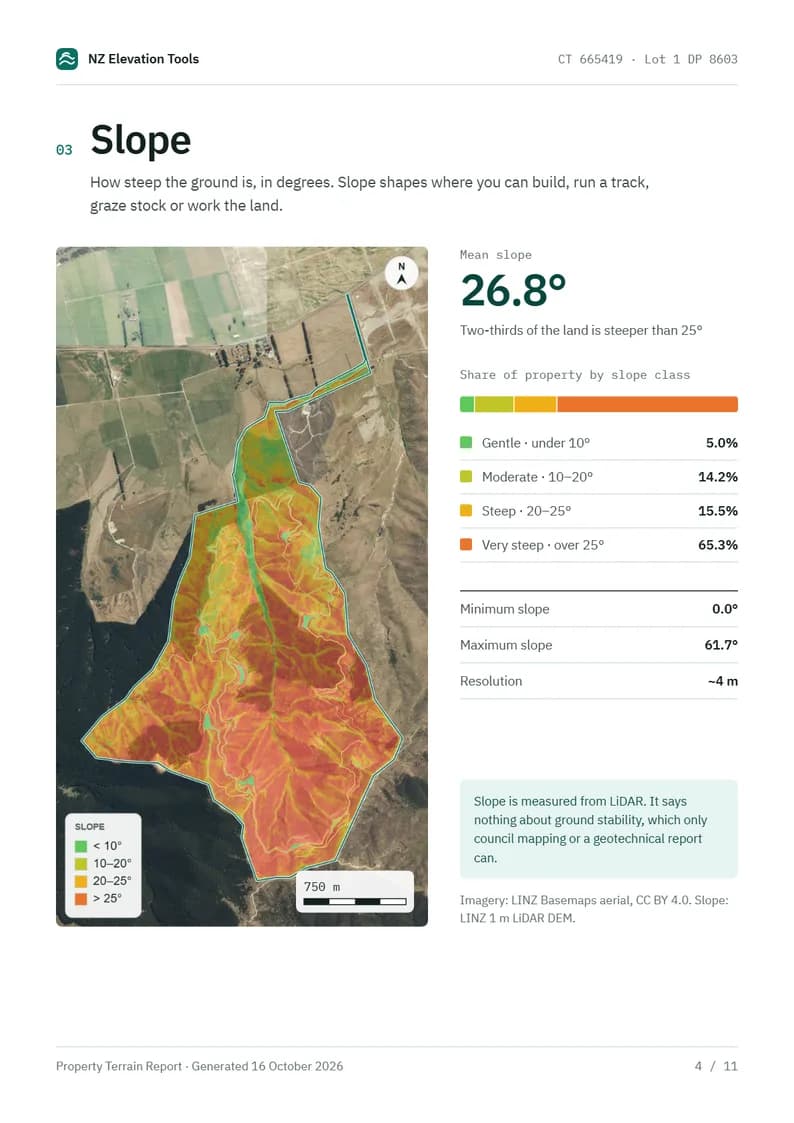
p.4Slope. The slope map and a bar of slope classes: under 10°, 10 to 20°, 20 to 25° and over 25°. Mean slope here is 26.8°, and the page says plainly that slope is steepness, not ground stability. 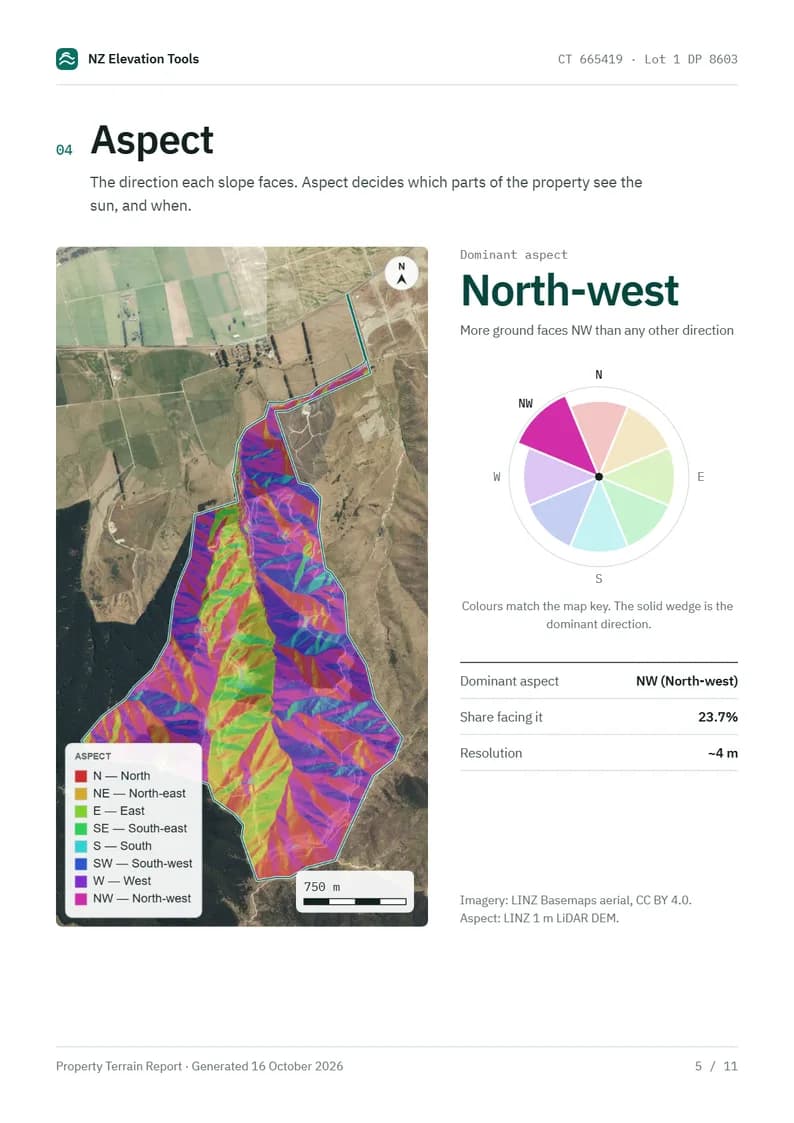
p.5Aspect. Which way the ground faces. The compass highlights the dominant direction, north-west on this block, toward the afternoon sun. 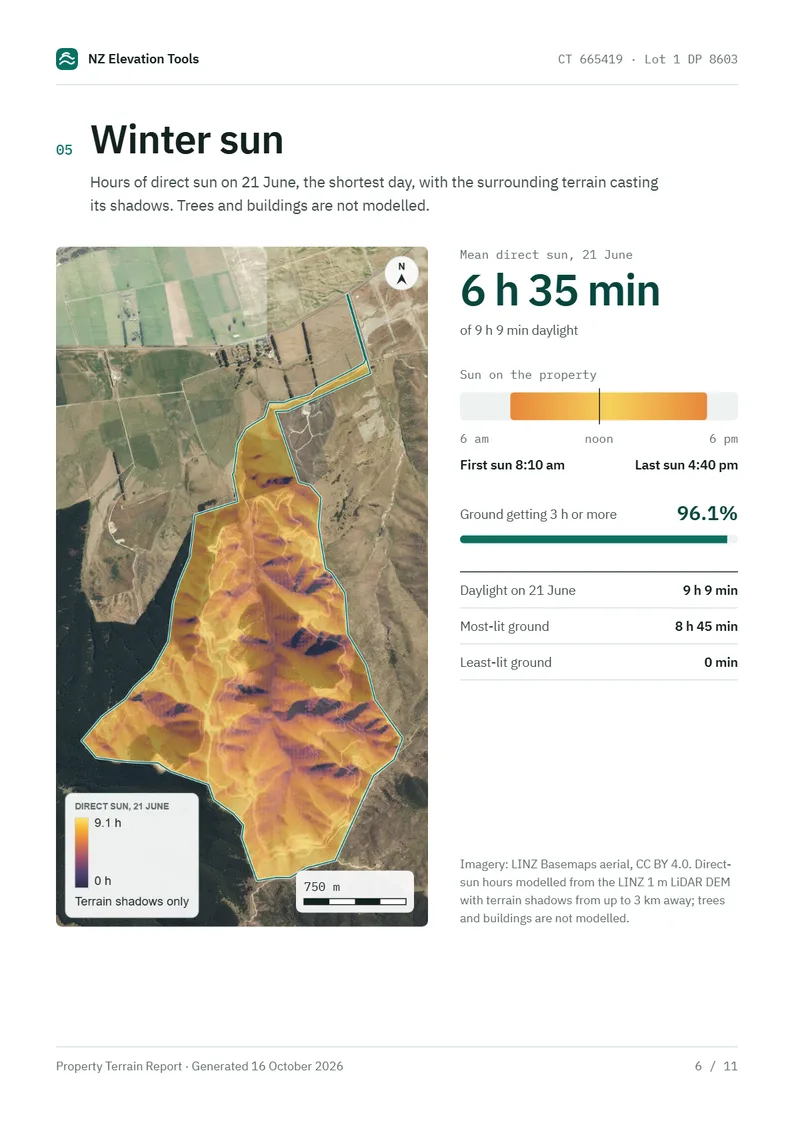
p.6Winter sun. Direct sun on 21 June, the shortest day, with the terrain around the block casting its shadows. First sun 8:10 am, last sun 4:40 pm, an average of 6 h 35 min, and 96.1% of the block gets three hours or more. 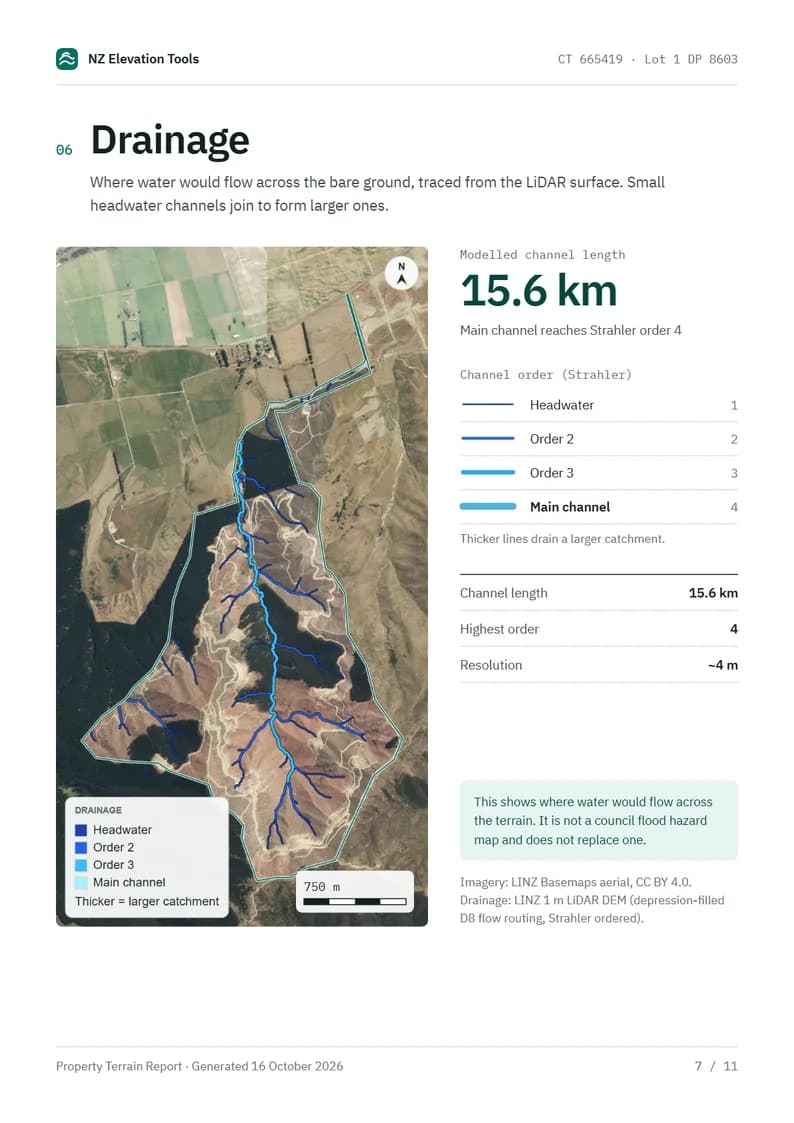
p.7Drainage. Where water would flow across the bare ground: 15.6 km of modelled channels, headwaters joining into one main channel that runs north down the central valley. The page states that this is not a council flood map and does not replace one. 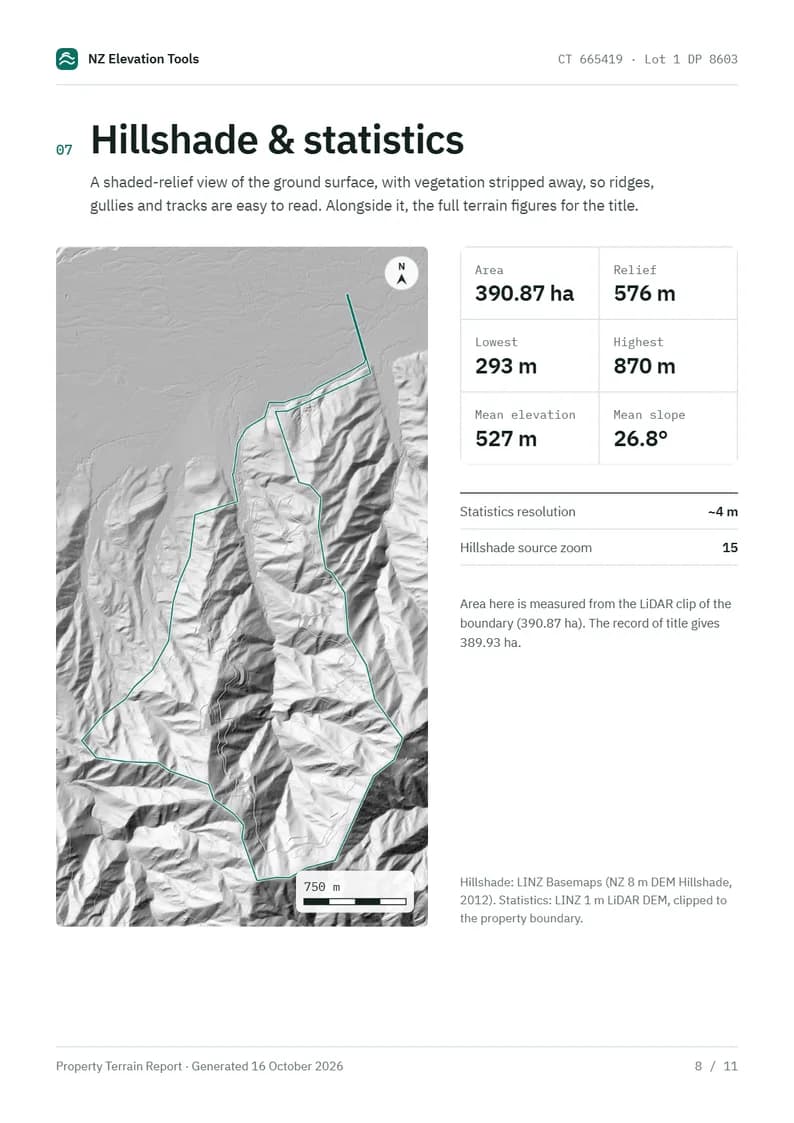
p.8Hillshade and statistics. The block as shaded relief, with vegetation stripped away so ridges, gullies and tracks read clearly, and the full set of terrain figures. Where the LiDAR area and the title area differ, both are given. 
p.9Before you commit. The records a terrain report cannot tell you about: title, zoning, flood, coastal, landslide, liquefaction, fault and tsunami mapping. Each row says why it matters and where to check, and the hazard rows point back to the pages of this report they relate to. 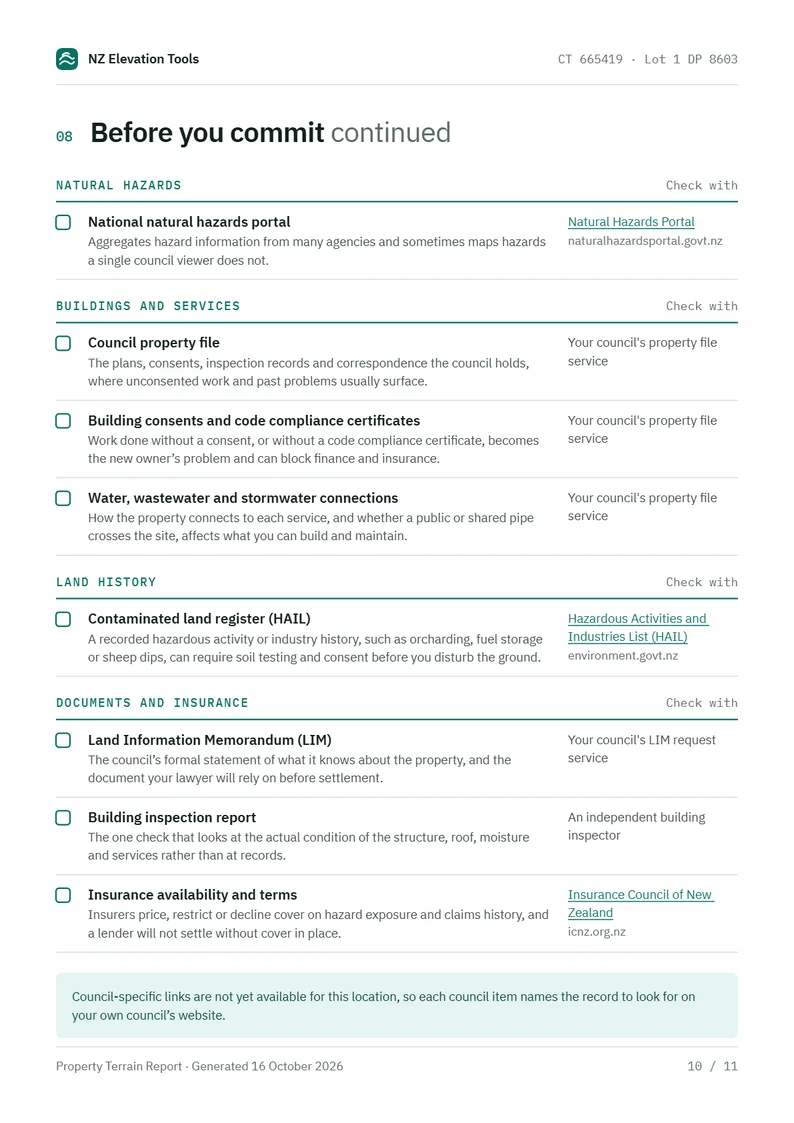
p.10Before you commit, continued. The checklist continues: the council property file, consents, water and stormwater connections, the contaminated land register, the LIM, a building inspection and insurance. Councils whose online maps the tool knows get direct links in the right-hand column. 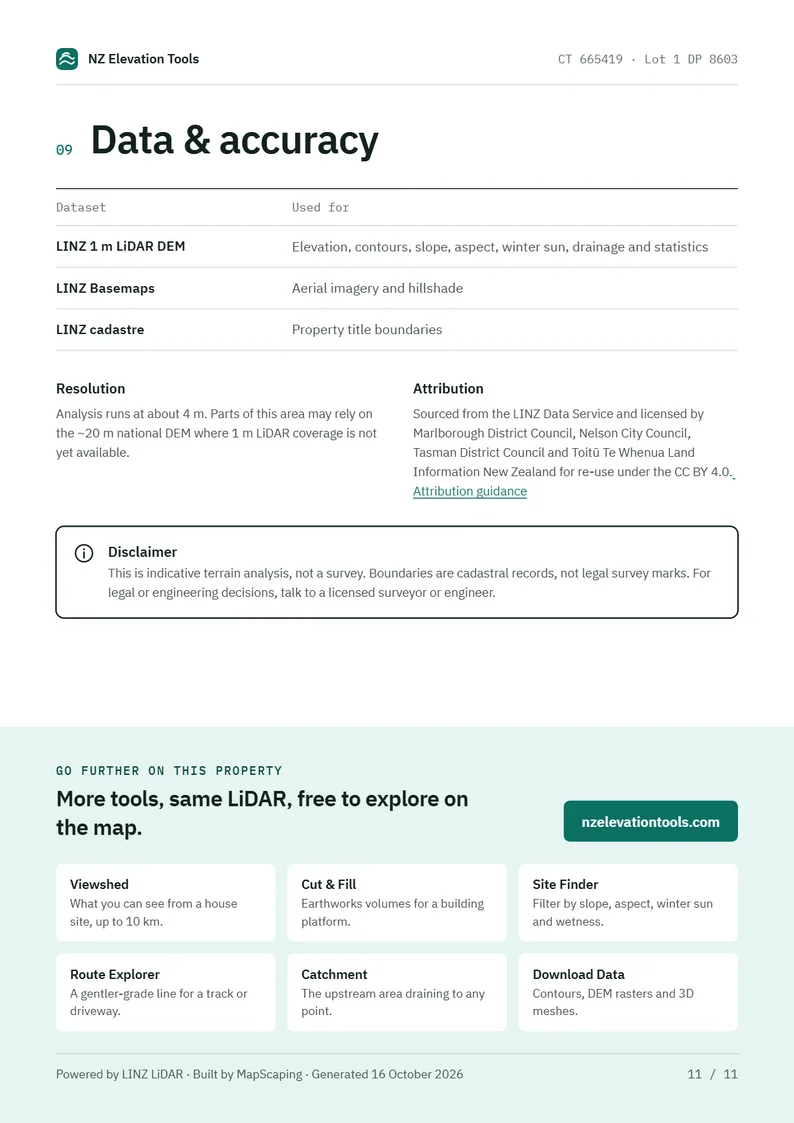
p.11Data and accuracy. What the report was built from, at what resolution, and who licensed the data for this area, followed by the disclaimer and the other tools that work on the same LiDAR.
How the report is made
Select a property on the map and the tool loads its LINZ parcel boundary, then analyses the 1 m LiDAR elevation model inside it, in your browser: contours, slope, aspect, direct sun on 21 June, modelled drainage and the terrain statistics. The findings on page 2 and the figures on every page are written from those measurements, so the report never says anything about the land that was not measured.
The checklist on pages 9 and 10 is the same for every property. It lists the official records a terrain report cannot replace, each with a reason and where to check it, and nothing in it means the property is free of any of them.
Free to run · pay to download
See the full result on the map free, with no account. Download the PDF report and the data bundle (PDF, contours and elevation GeoTIFF) with a pass: NZ$49 for 7 days or NZ$299 for 12 months, one-off, GST included, not a subscription. Every download on the site is included while the pass lasts.
Questions
Is this a real property?
Yes. CT 665419 is a 389.93 ha freehold title in the Marlborough land district. The boundary came from the LINZ cadastre and every figure was measured from the LINZ 1 m LiDAR model inside it. It makes a good sample because its steep, varied terrain gives every page something to say.
Will my report look the same?
It has the same pages in the same order. The maps are drawn for your boundary, the figures and findings are measured for your land, and the checklist links straight to the online maps of councils the tool knows. Everything else, including the disclaimer and the data page, is the same for every property.
Do I need a pass to see my own report?
No. Select a property on the map and the report tool builds the preview free, with no account. Downloading the PDF or the data bundle needs a pass.
Data and attribution
Pages from a report generated by NZ Elevation Tools on 16 October 2026. Aerial imagery and hillshade from LINZ Basemaps. Sourced from the LINZ Data Service and licensed by Marlborough District Council, Nelson City Council, Tasman District Council and Toitū Te Whenua Land Information New Zealand for re-use under the Creative Commons Attribution 4.0 International licence.
Elevation and cadastral data is sourced from the LINZ Data Service and licensed for re-use under the Creative Commons Attribution 4.0 International licence. Copyright in each LiDAR survey belongs to the body that commissioned it — a regional or district council, Waka Kotahi, NIWA and around thirty others — rather than to LINZ, which hosts and processes the national dataset. Every file exported from this site names the licensors whose surveys cover the area, and anything you publish from those files carries the same attribution requirement. See https://www.linz.govt.nz/products-services/data/licensing-and-using-data/attributing-elevation-or-aerial-imagery-data